Model Development
A TAZ is one of the basic spatial unit of travel analysis in OR-RAMP. All of the model results from OR-RAMP can be analyzed at the TAZ level including commuting pattern and mode choice. TAZs are intended to model automobile travel. Therefore, they can be much larger than MAZs since automobile impedance is less sensitive to small differences in zone size/shape. The size of TAZs can vary with the model application and can be as small as a block or more than 10 square miles. A typical TAZ system should be specifically designed to fit local planning needs by MPOs. The analyst should be cognizant of the following guidelines when delineating TAZ boundaries:
Zonal boundaries should follow Census boundaries as faithfully as possible. This is essential as the Census Bureau directly provides socioeconomic data at a variety of geographies including Census Block and Census Tract which can be used as inputs to the ABM with little or no manipulation. If a TAZ were to split a Tract or a Block, an allocation methodology to distribute the data from the split Census geography needs to be developed.
Also, Census provides a fully disaggregate dataset called Public Use Micro-data Sample at the level of a Public Use Micro-data Area (PUMA) – this dataset is used as seed data in the synthetic population. Defining TAZ boundary to be consistent with PUMA makes the population synthesizer allocation procedure more accurate.
Natural barriers such as rivers or mountains or man-made barriers such as railway tracks constitute physical boundaries. Physical boundaries restrict free movement and a centroid connector that passes over a barrier to access a road network would be unrealistic. This can be prevented by using the physical barrier as the zone boundary.
TAZ boundaries should be consistent with political boundaries such as city, county, MPO and state boundaries. This will help in performing sub-area analysis such as city-city/county-county flows. If the region uses planning districts for performing similar analysis it would be useful to line the TAZs with the planning district boundaries as well.
Consistency with previous zone boundaries should be maintained whenever possible. This would help preserve valuable socioeconomic data and the capability for comparisons.
Another factor to consider when delineating TAZ boundary is the highway network. Similar to physical boundaries discussed above, facilities including freeways, expressways, and arterials act as access barriers and hence should not split a TAZ. Arterials are used as TAZ boundaries, because they are frequently used as Census boundaries. Linking connectors to arterials results in better distribution of traffic on the network.
TAZs should be created such that it has homogenous land-use and socioeconomic characteristic. For example, a major retail development should be placed in a different TAZ than a neighboring residential development. This segmentation helps the transportation planner systematically understand activity generation as well as it helps in minimizing intra-zonal travel. In areas of dense developments, such as the central business district, it is not always possible to satisfy this condition. However, MAZs nesting within these mixed use development TAZs can be used to address this issue to some extent.
Each TAZ should consist of one non-overlapping polygon and should be uniquely identifiable using an identification code. In general, the identification code should be continuous (no skipped IDs) for the set of TAZs in the region (although it can be helpful and common practice to create discrete number series for sub-regions within the model; example within the MPO is TAZ series 1000, outside the MPO is TAZ series 2000). Also, the TAZ system should be contiguous and its coverage should span the study region (MPO in this case).
TAZ centroids should be the center of activity for automobiles, i.e. where automobiles entering the zone want to go. They should accurately represent actual roadway access connections and should not cut across barriers (tunneling). Also, sufficient number of centroid connectors needs to be coded so as to avoid concentrated loading of trips from a zone onto a particular link. It is also important not to connect a centroid to an intersection, ramps or any access restricted facility.
Areas in the region that could potentially undergo development in the future should be identified and the analyst should consider separate TAZs even if the exact development boundaries are fully known in the current year.
MAZ is the smallest spatial unit of analysis in the ABM and is intended to model relatively short distance travel (i.e., walk and walk to/from transit). MAZs are generated by performing GIS operations on the Census Block and TAZ layers; explained further below. Most of the rules that applied for TAZ boundaries can also be used for MAZ boundaries. The following general guidelines should be kept in mind when creating MAZs
- MAZs should nest within TAZs and they should be coded with the ID of the TAZ it nests in (this coding can be achieved programmatically).
- As noted earlier, MAZs are used to characterize walk access – hence in areas where there is a significant amount of walk travel (dense developments such as CBD) MAZs should be small enough to walk across.
- As with TAZ, MAZs should contain homogenous land-use. For example, if one zone has two distinct areas, one with housing and one with employment, each distinct area should be a separate MAZ.
- MAZs of small irregular shapes should be reviewed and the possibility of merging it with adjacent MAZs should be explored.
- MAZs that only encompass a roadway element (e.g., a rectangular-shaped MAZ that covers a freeway and no open space, buildings, or households) should be combined with neighboring MAZs.
- MAZs should recognize physical boundaries. Ideally, if a TAZ is delineated properly there will not be any conflicts of MAZ boundaries with barriers and major facilities. But for a MAZ, care should be taken so as not to cut across streets, unless the street experiences very low volumes or it is an alley. If MAZs encompass land on either side of a higher-level street, they should be split.
- For areas in which development is anticipated, a relatively large MAZ that is generated from the procedure should be separated into smaller MAZs.
- MAZ centroids should be the center of activity for people, i.e. where people entering the zone want to go. Centroids generated based on geographic center should be reviewed to ensure this. Centroid connectors for MAZs connect to the all-streets navigation network and are generated on the fly.
- Another criteria for coding MAZs is that they should be small if there is a high density of TAPs, since we want to reflect the choice/walking time between MAZs and TAPs and if the MAZs are too big they won’t increase the accuracy of the walk times in the model.
This section describes the process of using census data to help create and define MAZ boundaries, which can have advantages since most the base year population data will be most readily available from census. This process of creation of MAZ is a partially automated and a partially manual process. For creating a MAZ layer, the Census Block layer and the TAZ layer for the region are required.
-
The Census block layer needs to be reviewed for small and irregular polygons. These should either be dissolved into adjacent blocks or when necessary the boundaries should be edited.
-
Clip the edited block layer by the TAZ layer.
-
Calculate “sliverness” and “roundness” (add two fields if it’s first time):
- SLIVERNESS= [Shape_Area]/[Shape_Length]
- ROUNDNESS= ([Shape_Area]x4x3.14)/([Shape_Length]^2)
-
Identify the sliver polygons. The thresholds (S and R) for identifying the sliver polygons should be arrived at based on experimentation by the analyst (an example set of thresholds is shown in Thresholds Used for Creating MAZ System for MORPC for the Mid-Ohio Regional Planning Commission (MORPC) model). For each pass of elimination the analyst should judge if the selection rule identifies sliver polygon to a reasonable degree.
- SLIVERNESS<=S AND ROUNDNESS <=R
| Iteration | S | R |
|---|---|---|
| 1 | <=30 feet | - |
| 2 | <=30 feet | - |
| 3 | <=120 feet | 0.9-1.1 |
| 4 | <=120 feet | <=0.1 |
| 5 | <=50 feet | <=0.15 |
| 6 | <=40 feet | - |
| 7 | <60 feet | <=0.40 |
| 8 | <=42 feet | |
| 9 | <=0.07 |
-
Apply “Eliminate” tool (Data Management/Generalization) to remove the sliver polygons (eliminating polygon by “LENGTH”).
-
Intersect the resulted polygon in Step 5 with the TAZ layer to generate the preliminary MAZ layer
-
Calculate “sliverness” and “roundness” for the preliminary MAZ layer polygons:
- SLIVERNESS= [Shape_Area]/[Shape_Length]
- ROUNDNESS= ([Shape_Area]43.14)/([Shape_Length]^2)
-
Eliminate slivers TAZ by TAZ based on a selection criteria. (this can be automated using a script)
-
Determine how many slivers remain after Step 8 and repeat Step 8 if necessary.
The automated process just described should be accompanied by visual inspection of the resulting spatial system. The analyst should verify if the zone system makes intuitive sense and identify outliers (for example an “island zone” – a zone completely contained within another zone or zones that project into the ocean are some of the issues that were encountered in regions such as MORPC and MTC) that are missed in the cleanup process.
Please note that the approach just described assumes that the region has a finalized TAZ layer to work with. Another approach would be to start by creating a MAZ system from the Census block layer (applying steps 1, 3, 4 and 5) and then grouping MAZs to create TAZs.
TAPs represents transit access points in the region – a TAP can be a single transit stop or an abstract location representing a collection of stops. TAPs serve as the origins and destinations of transit trips for network assignment purposes.
- TAPs should nest within MAZs and they should be coded with the ID of the TAZ it nests in (the coding is achieved programmatically).
- Stops served by express service should be coded as an individual TAP.
- When multiple stops are collapsed into a TAP, the location of the TAP should be closest to the stop that experiences maximum foot falls. This is done to accurately capture the relative competition of the stops within a TAP.
- Transfer points should be represented by a TAP as more often than not these also serve as major access points.
- Again, TAP to MAZ and TAP to stop connectors are generated on the fly.
The procedure selects stops to become TAPs through a series of sampling and buffering routines by mode. This procedure has been previously used to automate the TAP creation for MTC and Oregon Statewide network. For SOABM, all stops were used as TAPs since there were less than 500, which avoids runtime and data management issues. The procedure can be described in the following steps:
- Calculate or retrieve the following stop attributes:
- Number
- Number of lines served
- X coordinate
- Y coordinate
- Modes served
- Is beginning or end of a line
- Number of stops within a user specified buffer distance (currently ½ mile)
- Best mode served (Express service if available; if not then bus)
- Label each stop that is the beginning or ending of a line as a TAP.
- Labels each stop that serves a premium (fixed-guideway transit such as bus rapid transit or light-rail) mode as a TAP.
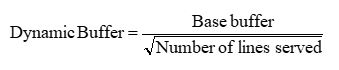
- By bus line, iterate through stops and calculate a dynamic buffer that is a function of the number of lines served and stops within the base buffer.
Thresholds Used for Creating MAZ System for MORPC shows the buffer thresholds used when processing the Oregon statewide network. These thresholds should be customized by the analyst to better represent TAP coverage in the region.
This buffer is used to identify candidate stops to become TAPs. Essentially it is used to sample stops along routes and is sensitive to stop density to ensure more TAPs are created in more stop dense areas.
| Stops In Buffer | Base Buffer (miles) | Buffer range (from / to (miles)) |
|---|---|---|
| 1-5 | 0.50 | 0.224 to 0.500 |
| 6-15 | 0.33 | 0.085 to 0.135 |
| 16-30 | 0.25 | 0.046 to 0.063 |
| 31+ | 0.15 | <0.027 to 0.027 |
- After identifying candidate stops to label as TAPs, loop through the candidate stops and condense the candidate stops to TAPs using a restricted buffer set to a 0.25 miles distance.
- All unassigned candidate stops by mode within the current TAP buffer are assigned to the current TAP.
- Finally, all stops without a TAP are assigned the closest TAP by mode.
At the end of the procedure each stop is coded with its TAP stop. In practice, a new zone centroid will be created for each TAP node and stop to TAP connectors will be created programmatically to connect the transit network stops to the TAP nodes for assignment.
This section documents the source of land-use inputs to be prepared for new deployments of OR-RAMP and alternative land-use scenarios for the Southern Oregon model. The following sections lists out the variables in the input file and describes how to develop each variable.
Zonal data is specified for a number of purposes, including:
- Constraints on the population synthesizer
- To calculate of density, 4D variables, and accessibility variables
- Describe the cost of parking considered by mode choice
- Used as size (attractiveness) terms in destination choice models
The OR-RAMP model requires zonal data specified at the MAZ level. MAZ Inputs and their Source shows the fields in the MAZ data file and the source of each field. Most of the data in the file is assembled using outputs from the socio-economic forecast and Census data.
| Column | Description | Source |
|---|---|---|
| MAZ | MAZ Number | |
| TAZ | TAZ Number | |
| HH | Total number of occupied housing unit | This set of data can be obtained at Census Block level from Census or at MAZ/TAZ level from socio-economic forecast. In case the data is obtained from the Census the households needs to be allocate to the MAZ based on point-in-polygon approach or proportionally distributed based on the overlapping area. |
| HH_SF | Number of occupied single-family households | |
| HH_MF | Number of occupied multi-family households | |
| HH_MH | Number of occupied mobile-home households | |
| HH_DUPLEX | Number of occupied duplex households | |
| HH_GQ_CIV | GQ civilian (half-way houses and other similar group quarters not associated with military housing, on-campus housing, or fraternities/sororities) | Group quarters control totals can be derived from Census non-institutionalized Group Quarters totals. However, they should be further broken out into military, university, and other group quarters by obtaining local land-use data. |
| HH_GQ_MIL | GQ military (includes military group quarters housing) | Military group quarters can be obtained by discussions with local military base housing officials. It is only necessary for regions with significant military employment. |
| HH_GQ_UNIV | GQ University students (on-campus or off-campus dormitories, fraternities, and sororities) | The University GQ population can be estimated based on the number of beds in University dorms and fraternity/sorority houses, from local university plans or discussions with university facilities department staff. |
| HHS | Average household size in the MAZ | |
| POP | Total population | |
| HHP | Total household population (exclude GQ pop) | |
| EnrollGradeKto8 | Grade School K-8 enrollment | Enrollment data collected from schools/major University. |
| EnrollGrade9to12 | Grade School 9-12 enrollment | |
| collegeEnroll | Major College enrollment | |
| otherCollegeEnroll | Other College enrollment | |
| AdultSchEnrl | Adult School enrollment | |
| ECH_DIST | Elementary school district | Point to polygon using MAZ centroid layer and school district. |
| HCH_DIST | High school district | |
| HotelRoomTotal | Total number of hotel rooms | Landuse/ Hotel inventory |
| WRK_EXT_PROB | Probability of working outside the region | Derived from SWIM model. A single value of probability for the entire region or a measure for district/county or any finer geography depending on availability. |
| universitySqFt | Number of square feet of major university active space | Land-use data |
| EMP_CONSTR | Construction | 23 |
| EMP_WHOLE | Wholesale Trade | 42 |
| EMP_RETAIL | Retail Trade | 44 |
| EMP_SPORT | Sporting Goods, Hobby, Musical Instruments and Book stores | 45 |
| EMP_ACCFD | Accommodation and Food Services | 72 |
| EMP_AGR | Agriculture, Forestry, Fishing and Hunting | 11 |
| EMP_MIN | Mining, Quarrying, and Oil and Gas Extraction | 21 |
| EMP_UTIL | Utilities | 22 |
| EMP_FOOD | Food Manufacturing | 31 |
| EMP_WOOD | Wood Product Manufacturing | 32 |
| EMP_METAL | Primary Metal Manufacturing | 33 |
| EMP_TRANS | Transportation | 48 |
| EMP_POSTAL | Postal Service | 49 |
| EMP_INFO | Information | 51 |
| EMP_FINANCE | Finance and Insurance | 52 |
| EMP_REALEST | Real Estate and Rental and Leasing | 53 |
| EMP_PROF | Professional, Scientific, and Technical Services | 54 |
| EMP_MGMT | Management of Companies and Enterprises | 55 |
| EMP_ADMIN | Administrative and Support and Waste Management | 56 |
| EMP_EDUC | Educational Services | 61 |
| EMP_HEALTH | Health Care and Social Assistance | 62 |
| EMP_ARTS | Arts, Entertainment, and Recreation | 71 |
| EMP_OTHER | Other Services, Religious | 81 |
| EMP_PUBADMIN | Public Administration | 92 |
| EMP_TOTAL | Total employment | |
| parkarea | Category determining functionality of parking models – | This data should be derived from a Parking lot inventory |
| parkarea field codes: | ||
| 1. Trips with destinations in this MAZ may choose to park in a different MAZ, parking charges apply (downtown) | ||
| 2. Trips with destinations in parkarea 1 may choose to park in this MAZ, parking charges might apply (quarter mile buffer around downtown) | ||
| 3. Only trips with destinations in this MAZ may park here, parking charges apply (outside downtown paid parking, only show cost no capacity issue) | ||
| 4. Only trips with destinations in this MAZ may park here, parking charges do not apply (outside downtown, free parking) | ||
| hstallsoth | Number of stalls allowing hourly parking for trips with destinations in other MAZs | |
| hstallssam | Number of stalls allowing hourly parking for trips with destinations in the same MAZ | |
| hparkcost | Average cost of parking for one hour in hourly stalls in this MAZ, dollars | |
| numfreehrs | Number of hours of free parking allowed before parking charges begin in hourly stalls | |
| dstallsoth | Stalls allowing daily parking for trips with destinations in other MAZs | |
| dstallssam | Stalls allowing daily parking for trips with destinations in the same MAZ | |
| dparkcost | Average cost of parking for one day in daily stalls, dollars | |
| mstallsoth | Stalls allowing monthly parking for trips with destinations in other MAZs | |
| mstallssam | Stalls allowing monthly parking for trips with destinations in the same MAZ | |
| mparkcost | Average cost of parking for one day in monthly stalls, amortized over 22 workdays, dollars | |
| INTER_HALFMI | Intersection count within ½ mile | Calculated internally by the OR-RAMP |
| DU_DEN | Dwelling unit density within ½ mile | |
| EmpDen | Employment density within ½ mile | |
| PopDen | Population density | |
| RetEmpDen | Retail employment density within ½ mile | |
| TotIntBin | Intersection count bin | |
| EmpDenBin | Employment density bin | |
| DuDenBin | Dwelling unit density bin |