- Climate Measurer
- Olivia Svensson - os222ui
- Measuring temperature, light, and humidity.
- Time taken to do this project: approximately 25hrs total
I chose this project because of a desire to create a device with multiple sensors as well as actuators. I came to the conclusion that a device which can measure the climate and give insights as to the metrics would be highly useful for several purposes.
The project serves the purpose of gaining data from the current environment surrounding the microcontroller (as well as the sensors and actuators) in order to get valuable insights about the current climate. This device will alert the user if the humidity, light, or temperature goes above or below an unhealthy level. The user is alerted by LEDs which signal every second depending on the sensor data. The values can be adjusted depending on what you would like to monitor (it could be different kinds of plants, yourself, or a bird for example). For this version, I have created settings for different plants, giving insighs on the way their environment impacts their health.
The project will give me a better insight into how microcontrollers work. It will broaden my understanding of communication protocols, and how microcontrollers can communicate with sensors and actuators. Using the device will allow the user to gain insights as to their environment. This is often something which is ignored, so the Climate Measurer will likely provide new insights as to how the environment around you is. It is difficult for the human to observe more specific metrics when it comes to the climate, except for the very obvious, so this tool will be very useful, as the insights are not easily established otherwise.
The material list is provided below. All of the components used for the project are linked here with an image, as well as their price, the amount needed, and the link for purchasing.
- All of these materials can be found within the starterkit which Electrokit provides for 399kr https://www.electrokit.com/lnu-starter.
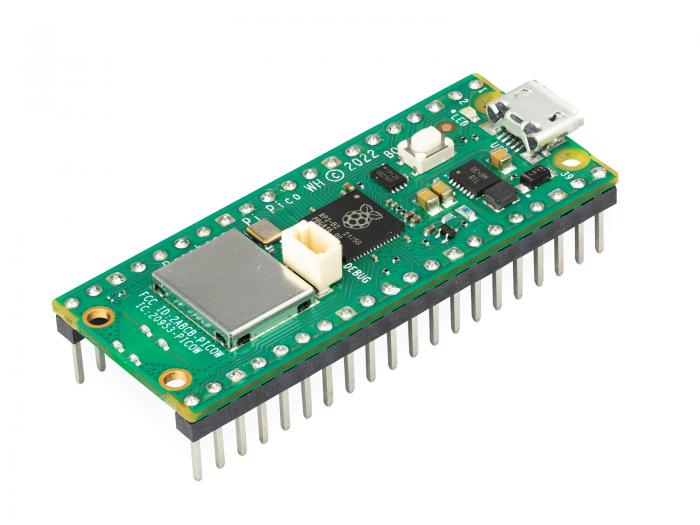
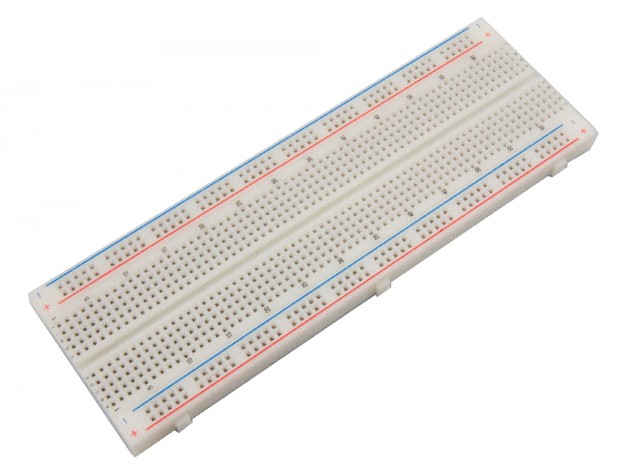
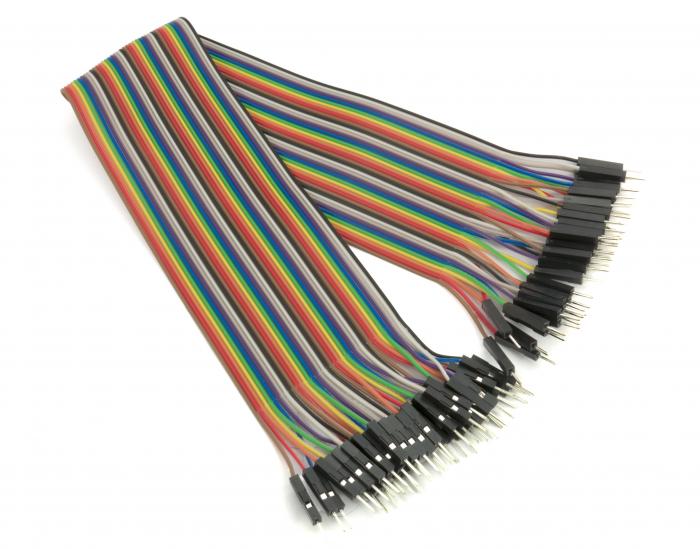
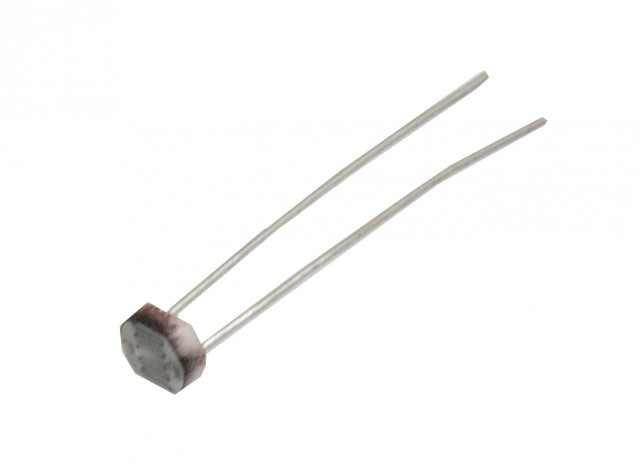
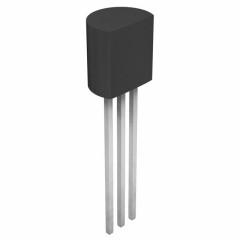
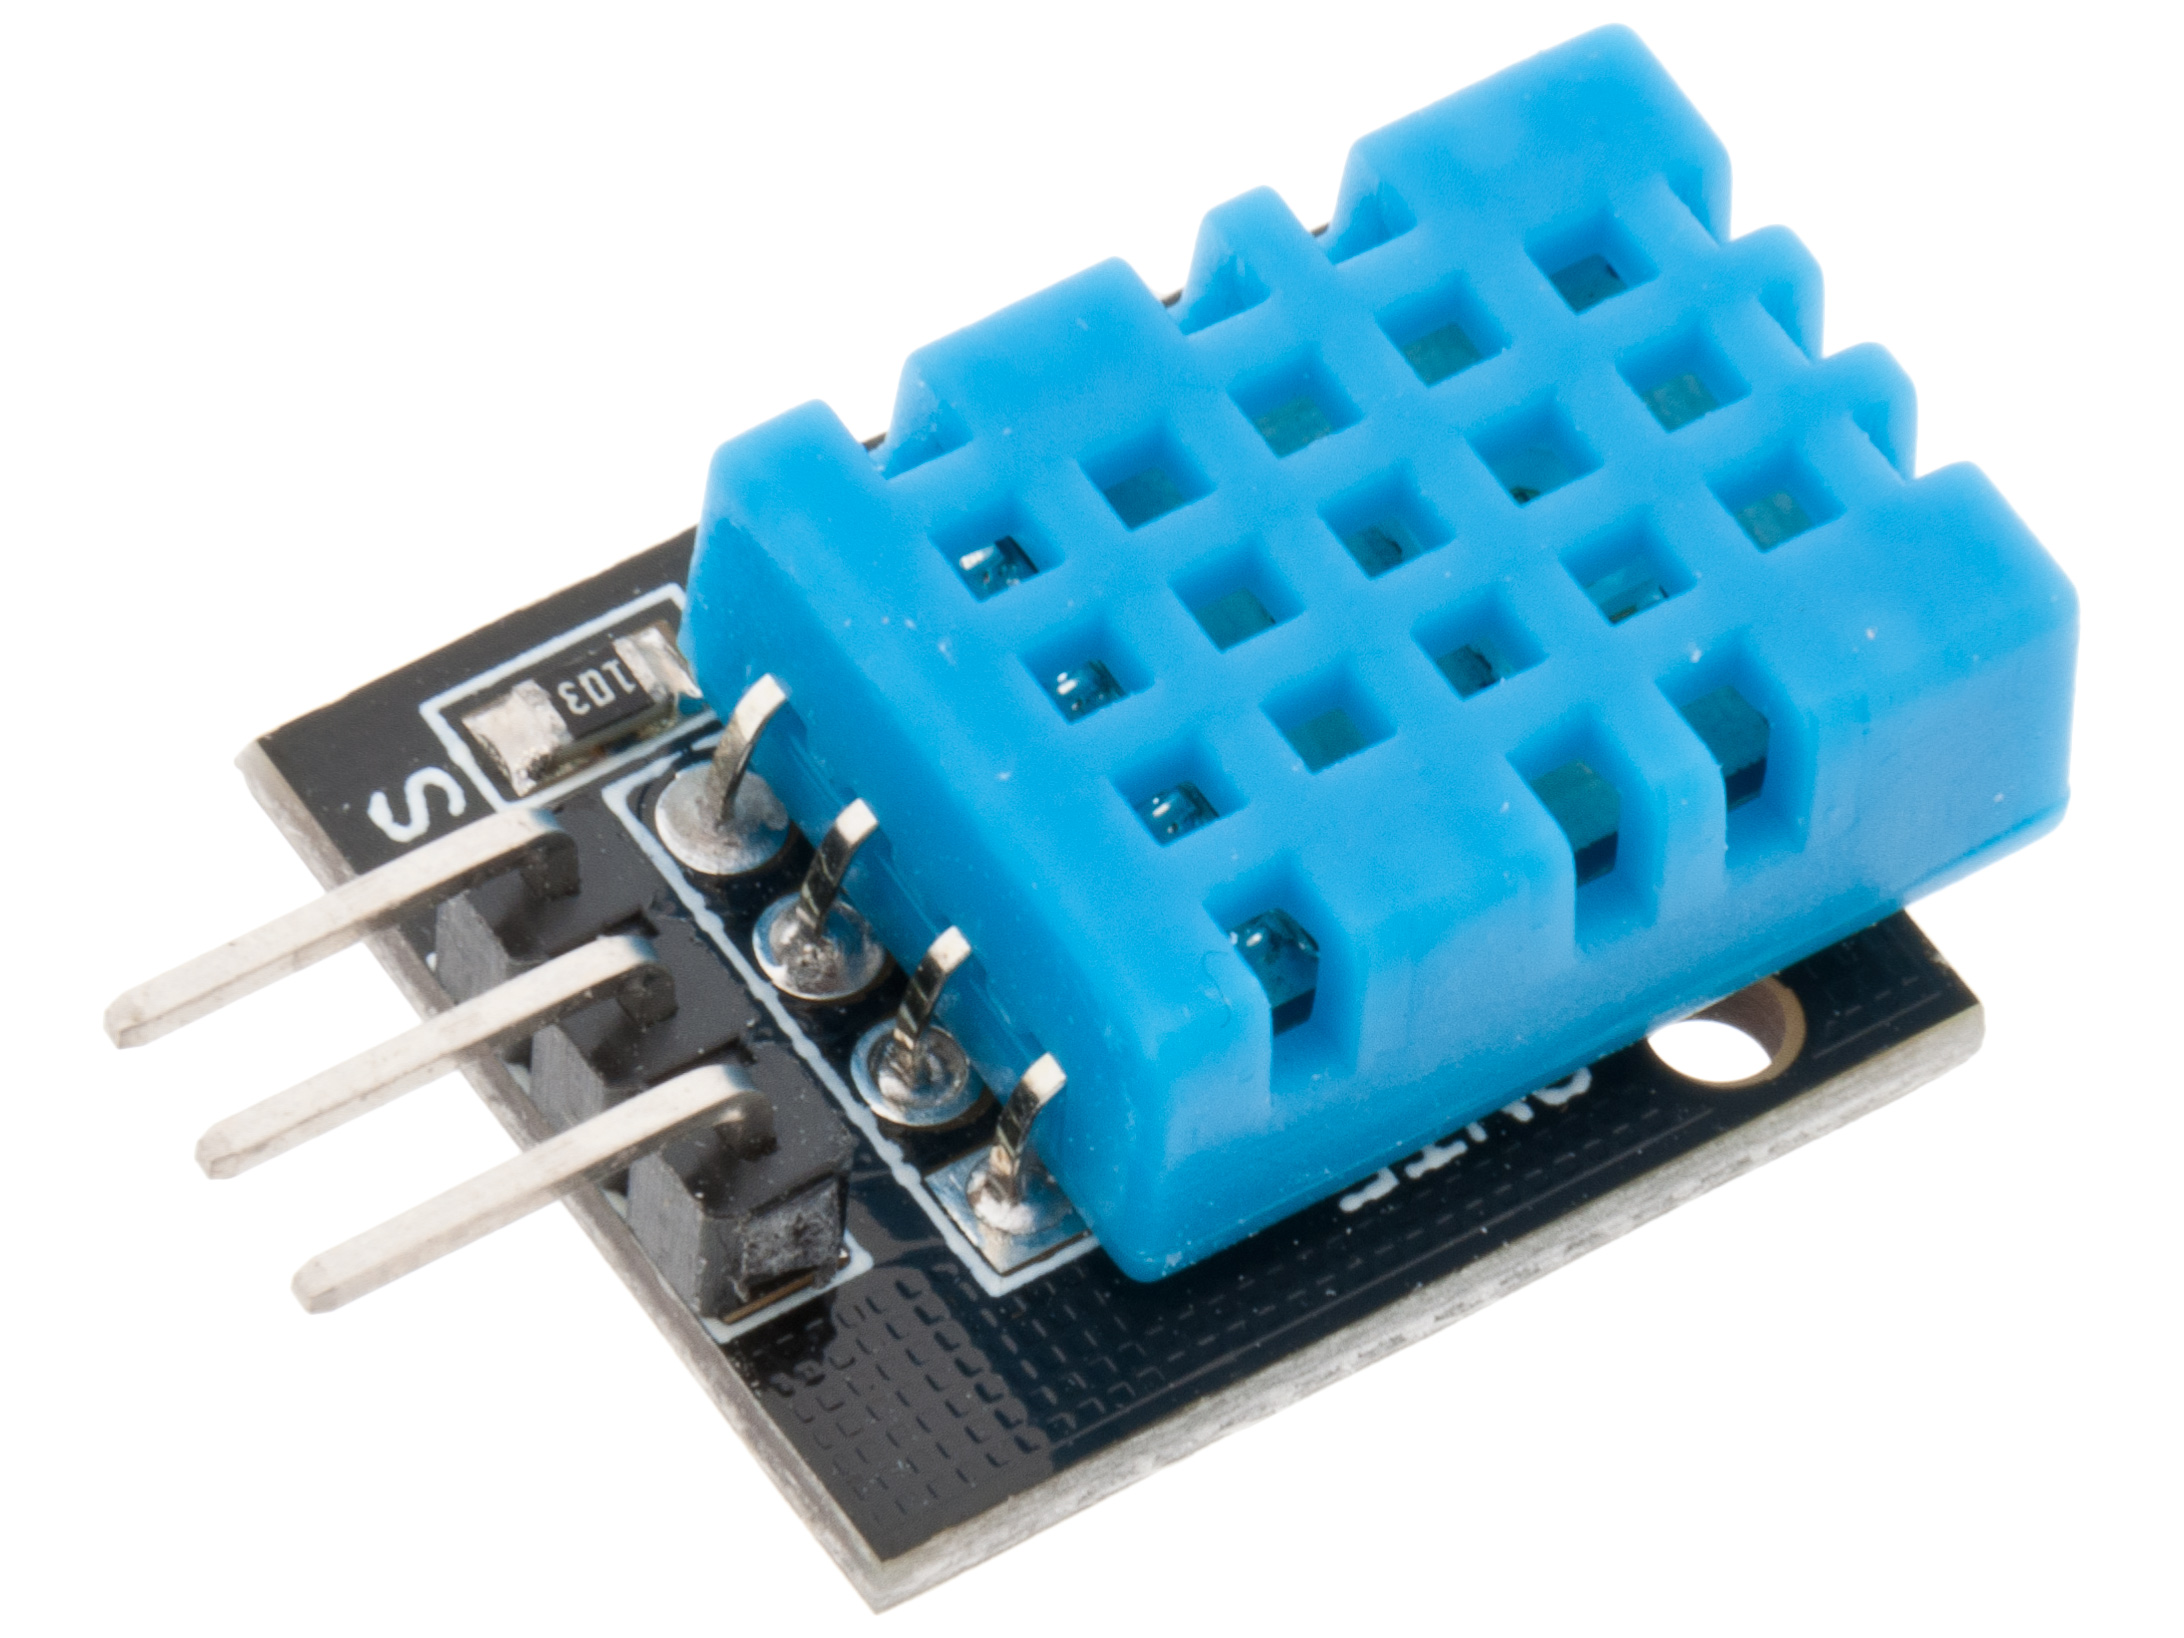
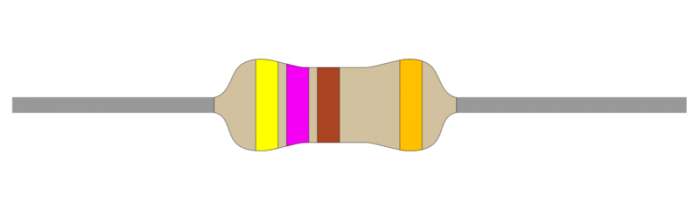
The Raspberry Pi Pico W is a microcontroller which essentially is a small computer. The microcontroller is the so called master, controlling all of the other components (slaves), acting as the brain. The breadboard makes it easier for me to connect all of the actuators and sensors with the microcontroller, as it provides slots for the different devices to be inserted into, and makes the task of connecting the devices together with wires less messy. The wires are used for connecting the components to the microcontroller (both to the different pins, the ground, and the power source). The DHT11 is used for measuring the humidity in this project, but can also be used for measuring the temperature. The MCP9700 is a temperature sensor used for measuring the temperature. The LCD is used for measuring the light. The resistor is used to control the current which flows through to the LCD. The resistor lessens the amount of current, and protects the device (LCD) from being damaged by the current.
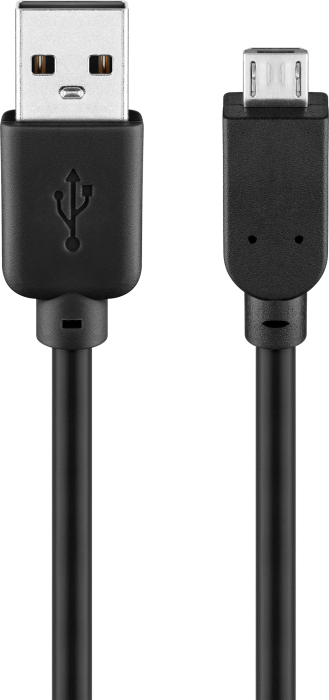
I am creating this project running the Windows 11 operating system. This is for personal preference, you can use your preferred OS. In order to flash the Pico WH, you need to connect the USB cable to the Pico WH. Then you need to press the BOOTSEL button on the Pico which is an oval white button, and hold it. Plug in the USB cable into your computer while still holding down the BOOTSEL button. Open up the device. Go to this page: https://micropython.org/download/RPI_PICO_W/ and download the latest firmware. Drag the downloaded file into the device. The window should automatically close. After this, you have successfully installed the firmware!
The IDE I chose is Visual Studio Code. Visual Studio Code, or VSCode is one of the most popular IDEs for software development. I chose it because I am comfortable with the IDE as I have previous experience programming in it. You can download VSCode here: https://code.visualstudio.com/download
The code is uploaded by pressing "upload to device", and then doing a hard reset. Then turning on the power of the device again. It can also be done by right clicking on the project and then going to pymakr, and then pressing upload project to device. The IDE can sometimes get stuck, which is solved by saving and closing down VSCode, then starting it again and repeating the procedure. Make sure that whenever you have done any changes, that you save the changes, and upload the code to the device, as otherwise, the old code will run on the device.
Node.js can be downloaded here: https://nodejs.org/en/download/package-manager
In VSCode, go to extensions and then search for "Pymakr", then click install. Pymakr is what we will be using when running the code in VSCode. Create a new Pymakr project by pressing the new icon for Pymakr which appeared, and then press "Create project". Create a new folder to hold the project. Enter the name for the project in the window at the top, click empty (as this is a new project). Select your Pico W device. It is possible that it shows up as some other name than that under "Device". Once you have done this, you are ready to start programming.
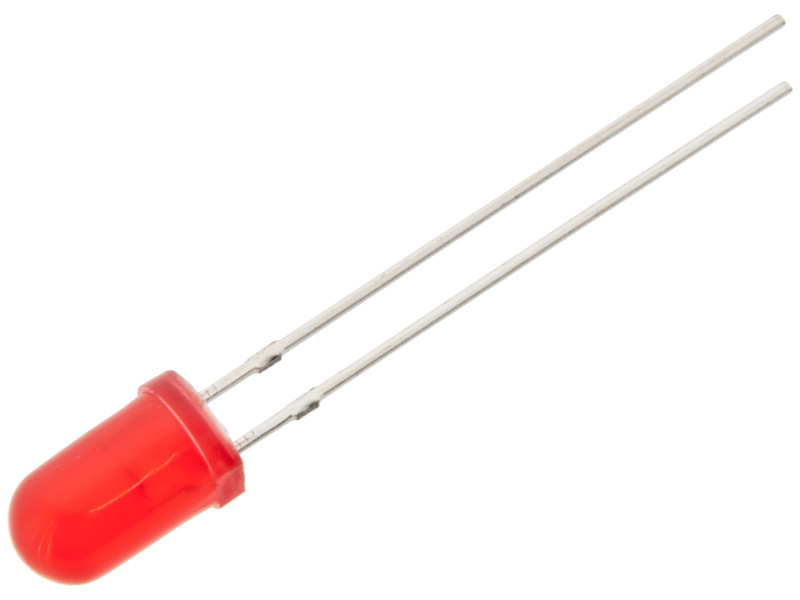
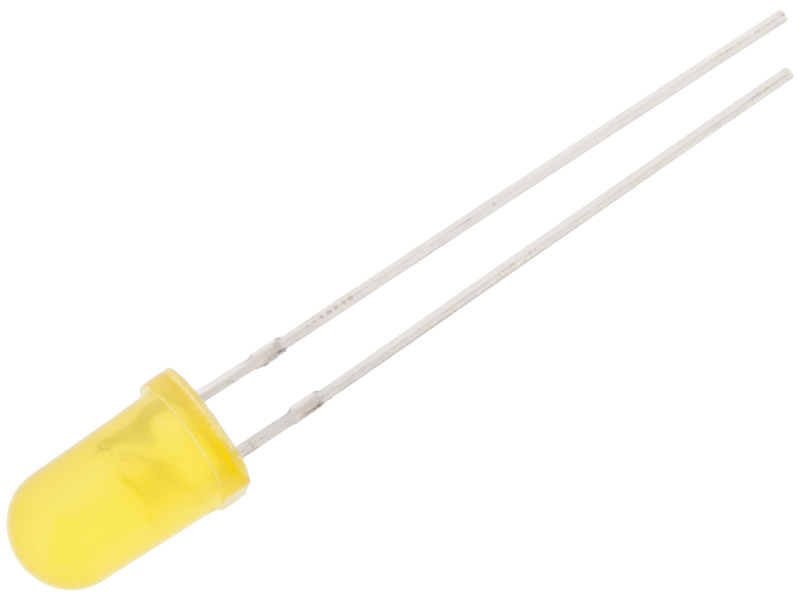
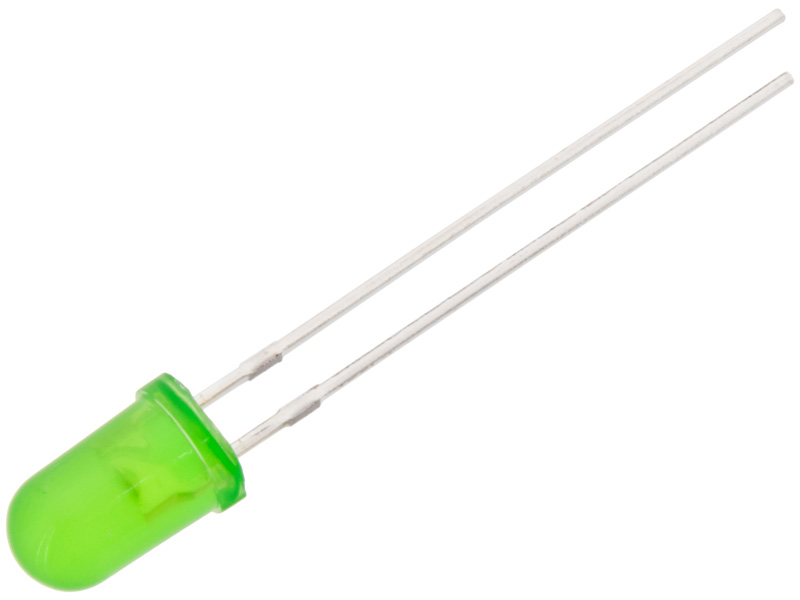
All of the sensors and actuators are wired parallelly. The ground is connected to the side of the breadboard, where the negative current is supposed to flow. The 3V3 pin provides 3.3V power out (power supply), which is connected to the side of the breadboard for the positive current. All of the components are connected to the power supply and the ground. All of the sensors and actuators are provided with 3.3V. The sensors and actuators are connected to GPIO pins on the pico, which stands for General Purpose Input/Output. The DHT11 sensor is connected to the 22nd GPIO pin. The MCP9700 sensor is connected to the 26nd GPIO pin which also works as an analog digital converter (ADC0). The LDR sensor is connected to the 27nd GPIO pin, and also has a resistor connected to it with 470Ω (ohm) resistance for controlling the current flowing to the LDR from the power outlet. The LEDs are connected to the ground and the GPIO pins on the board. The red LED is connected to the 19th GPIO pin. The green LED is connected to the 20th GPIO pin. The yellow LED is connected to the 21st GPIO pin. All of the components are connected to the Pico using male to male lab cables. The Raspberry Pi Pico is connected to the breadboard by pressing it down, connecting the metal pins to the breadboard.


.jpg?raw=true)

The LDR sensor already had a 2000Ω resistance. A resistor with a resistance of 470Ω was added to the series resistance, making the total series resistance 2470Ω. This is in order to limit the current in the circuit. Calculations were also made for the LEDs. The current is 25mA, and the source voltage is 3.3V, and the load voltage is 2V. This makes R = (3.3-2)/0.025 = 52Ω. The resistor with the lowest resistance in the kit I bought had a resistance of 330Ω. I could connect one of those resistors to each LED, however, I felt like the resistance needed was so miniscule that it was not needed to connect the resistors to the LEDs in order to limit the current. I tried the LEDs, and they did not become warm, so I determined it was not necessary. Resistors can be added for aesthetic reasons (managing the light emitted from the LEDs, the higher the resistance, the dimmer the light is going to be emitting from the LEDs).
Adafruit IO is a service which is cloud-based and designed for IoT applications. It provides many functionalities if you sign up as a user, such as data management in real time.
I chose this platform as it is very user friendly. The platform provides many different functionalities in one place, which is very convenient. With Adafruit, you can collect and store data from devices and sensors,which allows for data analysis and storing. You can also create dashboads, which I have done. The dashboards are customizable, and are used to visualize the data using different widgets such as charts, switches and graphs. In my case, I have used linear graphs, which helps visualize the data very clearly. You can also set up triggers and actions, which enables functionality to automatically happen once the data has reached a specific condition. I have done this by sending data to a discord server, using webhooks. Adafruit organizes the data into feeds, which you can send and receive data from.

The data from the sensors are stored in variables, with correlating names. In this version of the application, you have three options to choose from (orchid, moss, and cactus). The functions are the same, however, depending on the option you choose, the threshold will be different for the evaluations, as the plants have different needs in terms of ideal climate. Evaluations are made for all of the parameters in the application, where the values are passed into the function (the values passed in are diffeent for the different options). Once the evaluations are made for the data of the sensors, a LED evaluation is made, which lights up different LEDs depending on the values of the humidity, temperature, and light. If all of the values are good, the green LED will light up. If any of the values are a little bit over or under the ideal values, the yellow LED will light up. If any of the values are dangerously under or over the ideal values, the red LED will light up. Once this is done, the data gets sent to the feeds, which the client does by publishing the data. All of this is done every five seconds.
The data is transmitted using MQTT protocol. I am using Adafruit IO in order to both store the data, as well as visualize it. The packets which are sent throught the MQTT protocol always has a header, but they can also hve a variable header, as well as a payload. I am using the PUBLISH packages, which contains all three parts (fixed header, variable header, and payload).

This is an image of how the connection is established by creating and connecting a MQTT client to the Adafruit IO.

This image shows a function which sends data to the feeds, which is done by the client publishing values from the sensors to the corresponding feeds. This function is called every five seconds.
The data is sent every five seconds to the feeds by the client, which publishes the values from the sensors. Not all of the data is published to the three feeds at the same time, as Adafruit IO has put limits to how much/often you can publish to the feeds. I put a time.sleep for two seconds after each publishing, which made it possible for me to publish to all three feeds. When I didn't have any sleep between the publishes, only one of the feeds would be published to, which was the first one.
I used WiFi (a wireless local area network, in my case, the one in my apartment) as this was easy to set up. I had WiFi at home, so this was easily accessible. I connected to my WiFi using the SSID and the password. This was stored in a keys.py file which I put in my .gitignore file. I did not use LoRa, even thought this was intriguing, as there is need for a LoRa module in order to connect.
The protocol for transmitting data from the Pico to the feed is called MQTT. This was done by creating a MQTT client, and then connecting the client to the server. The client would publish data to the three feeds. I also used a webhook for a discord server I set up, which sent data as messages every twenty minutes if the temperature was over 30 degrees celsius. Image of this can be found under Automation/triggers of the data.
This part covers the visualization of the data.

The dashboard has three feeds. One for humidity, one for temperature, and one for the levels of light. All three feeds are presented as linear graphs as this helps visualize the data. The y-axis represents the values from the sensors, and the x-axis represents the time.
The data is saved every five seconds to the database. Due to the limits of transmitting data to the feeds put in place by Adafruit IO, and as I had three feeds, I could not publish to all three feeds at the same time. In order to tackle this issue, I put a two second timer between each publishing of the data to the client. Adafruit IO keeps the values in the database for 30 days, and then eventually deletes it.
I chose to go with Adafruit IO. I am storing the data in feeds. The data can easily be downloaded if needed. I chose Adafruit IO as I initally tried a TIG stack solution where I was supposed to use an InfluxDB database. I had issues however with connecting the database with Grafana, which I could not manage to resolve, so I settled for an easier solution. Adafruit IO is very user friendly, and much easier to set up. This was the reason for the choice of database.

I activated a webhook link on the temperature values. If the value exceeds 30 degrees celsius, the value will be forwarded to the Discord server I set up. This will be done once every 20 minutes.
I had much ease with connecting the hardware components together and programming them. There was some issues with the LEDs, but it got resolved quickly after attending a workshop. I spent a lot of time trying to implement a TIG stack for the project. This took up a lot of time, as I had no experience previously with Docker or any of the other technologies included. This caused issues, as I did not have the proper knowledge for problem solving the errors which occurred.
I am happy with how the connections turned out, as I put time into trying to make the wiring look nice on the breadboard. I am happy with what I made with the sensors that I bought. I would have wanted to make a bigger project which implemented more sensors, and more complex logic behind it. This would however have required of me to buy more sensors, which I didn't want to do.
As for the software, I believe that it could be developed further. As it is right now, only three options for plants is provided. This could be expanded on. I was also considering making a more complex UI, rather than only having the terminal as an output, and then connecting it to the Pico. This would have made the program look much more professional, as an UI provides better user experience improves the usability of the system drastically. I also believe that the UI could have a section with the data which is stored in the database, presented to the user. I also believe that six more LEDs could have been connected, so that there would be nine LEDs instead of three. If these were to be implemented, then there would be one set of LEDs for each metric (temperature, light, and humidity), which would have made the readings more comprehensible and user friendly. I did not do this even though I wanted to, as I could not fit any more LEDs on the tiny breadboard I had.
.jpg?raw=true) This is a photo of when the application is running. This photo is taken when any of the values is under or over the preferred value for any of the three metrics, but it is not horrible. This makes the yellow LED light up. If the values are all good, the green LED lights up. If any of the values are very bad, then the red LED lights up.
This is a photo of when the application is running. This photo is taken when any of the values is under or over the preferred value for any of the three metrics, but it is not horrible. This makes the yellow LED light up. If the values are all good, the green LED lights up. If any of the values are very bad, then the red LED lights up.
Below is a link to a presentation of the system with an explanation and live demo showing how it works.

Important to note that I say in the video that the values get published to the client, which is not correct. What I mean is that the client publishes the values to the feeds, which are located on the server.