The Helsinki City Bikes have become an increasingly popular mode of transportation for citizens of Helsinki and Espoo, with more than 10 million trips taken between 2016 and 2020. As the city bike system continues to expand and evolve, it is important to gain insights into the usage patterns and trends of the bikes. In this data analysis project, I will explore the Helsinki City Bike dataset to uncover valuable insights about how citizens are using the bikes, when and where they are most frequently used, and how usage patterns have changed over time. By analyzing this data, I aim to gain a deeper understanding of the impact of the Helsinki City Bikes on the community and inform future decisions regarding the system's expansion and operation.
- Main data source: https://www.kaggle.com/datasets/geometrein/helsinki-city-bikes
- Webscraped data is from: https://www.cityfillarit.fi/en/
I conducted several steps to prepare the data for analysis, including:
- Treated null values by either removing them or imputing values where appropriate.
- Changed some metrics from meters (m) to kilometers (km) and from seconds (sec) to minutes (min) to make the data more user-friendly.
- Added specific columns that show the year, month, weekday, and hour of each rental to help with time-based analysis.
- Added "total_rentals" column based on "departures".
- Removed outliers, especially for distance and duration. I found some extreme values that were likely errors in the device that stores the bike metrics, so I removed them to improve the accuracy of the analysis.
- Dropped the column that shows the average speed in kilometers per hour because it had too many outliers and was not important for our analysis.
- Saved the clean data in a new file (clean_data.csv) that is now ready for prediction.
By taking these steps, we were able to ensure that our data was reliable and well-prepared for analysis.
In this project, one of my goals was to predict the total number of bike rentals without using a linear regression model. To do this, I first checked the distribution of the columns and realized that some were skewed, so I applied algorithmic transformation to these columns.
Next, I used an encoder to encode the categorical columns, and applied both the standard scaler and MinMax scaler to standardize the values and put them in the same range for the model.
After treating the data, I built the model. I printed out various metrics, such as R^2 score, mean squared error, root mean squared error, and mean absolute error. And visualized the performance of the model with a scatterplot.
Overall, the model performed well and provided accurate predictions for the total number of bike rentals.
Based on the analysis performed, several interesting findings were observed.
-
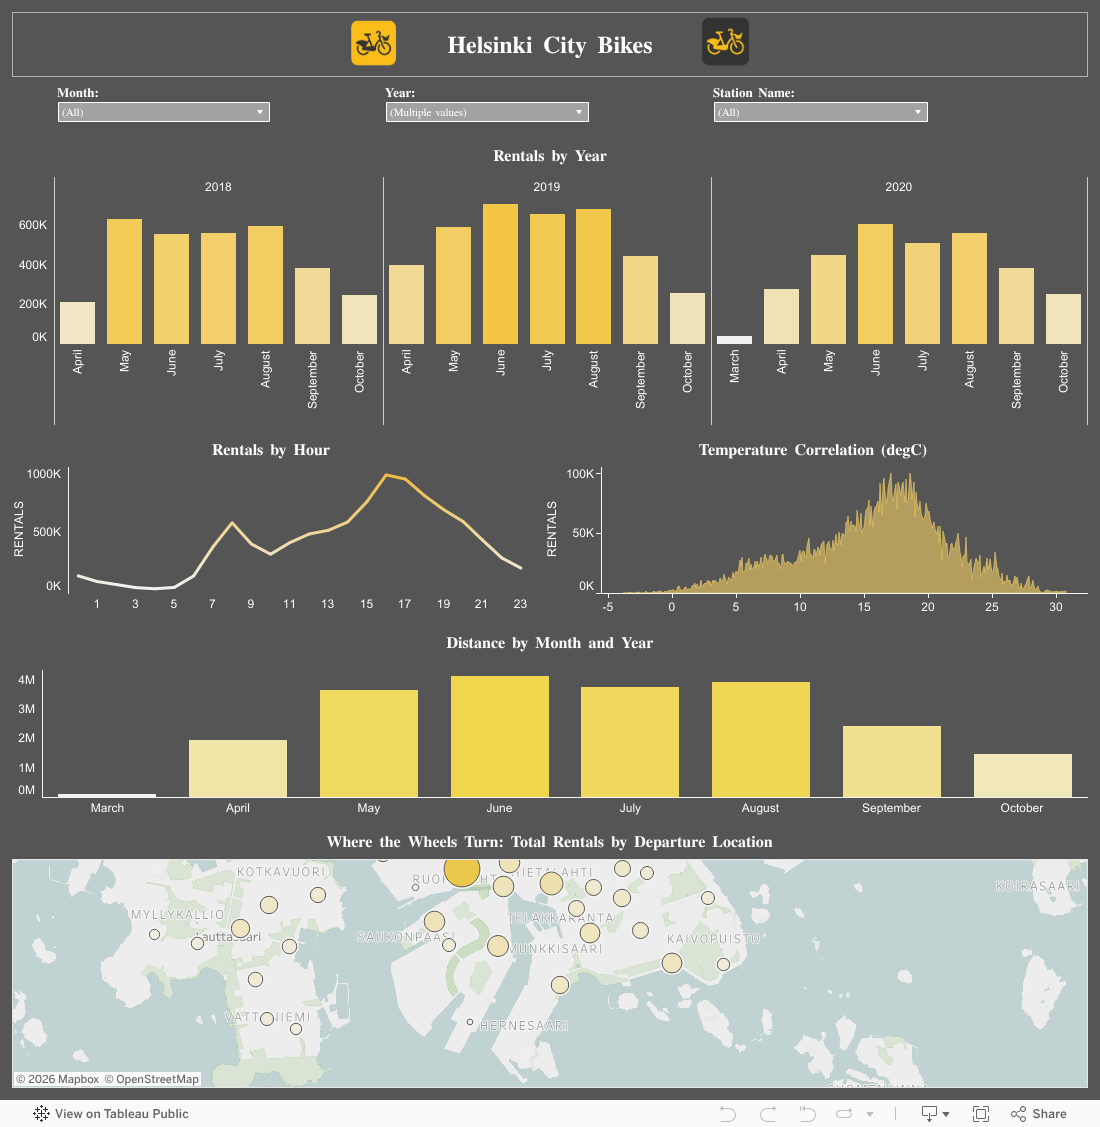
There is a correlation between the amount of rentals and the weather based on the degrees. The service is used more frequently when the weather is good, and temperatures are moderate. Secondly, the service is used more frequently between June and August, which are typically the months with better weather in Helsinki and Espoo.
-
There are spikes in the total amount of rentals early in the morning when people usually want to get to work or to school and also in the afternoon when people come back from school and work. This indicates that the service is mainly used for commuting purposes.
-
People travel more than 1M km per season with the bike system, which has a significant impact on how people move around the city in a more sustainable way.
-
The busiest stations where there are more departures and returns. The busiest stations are Itämerentori, Kamppi, and Töölönlahdenkatu.
Additionally, the results indicate that the bike-sharing system has a significant impact on how people move around the city in a more sustainable way. The insights obtained from this analysis can be used to inform policy decisions related to transportation and urban planning in the region.
https://public.tableau.com/app/profile/maria.soriano/viz/helsinki-city-bikes/dashboard