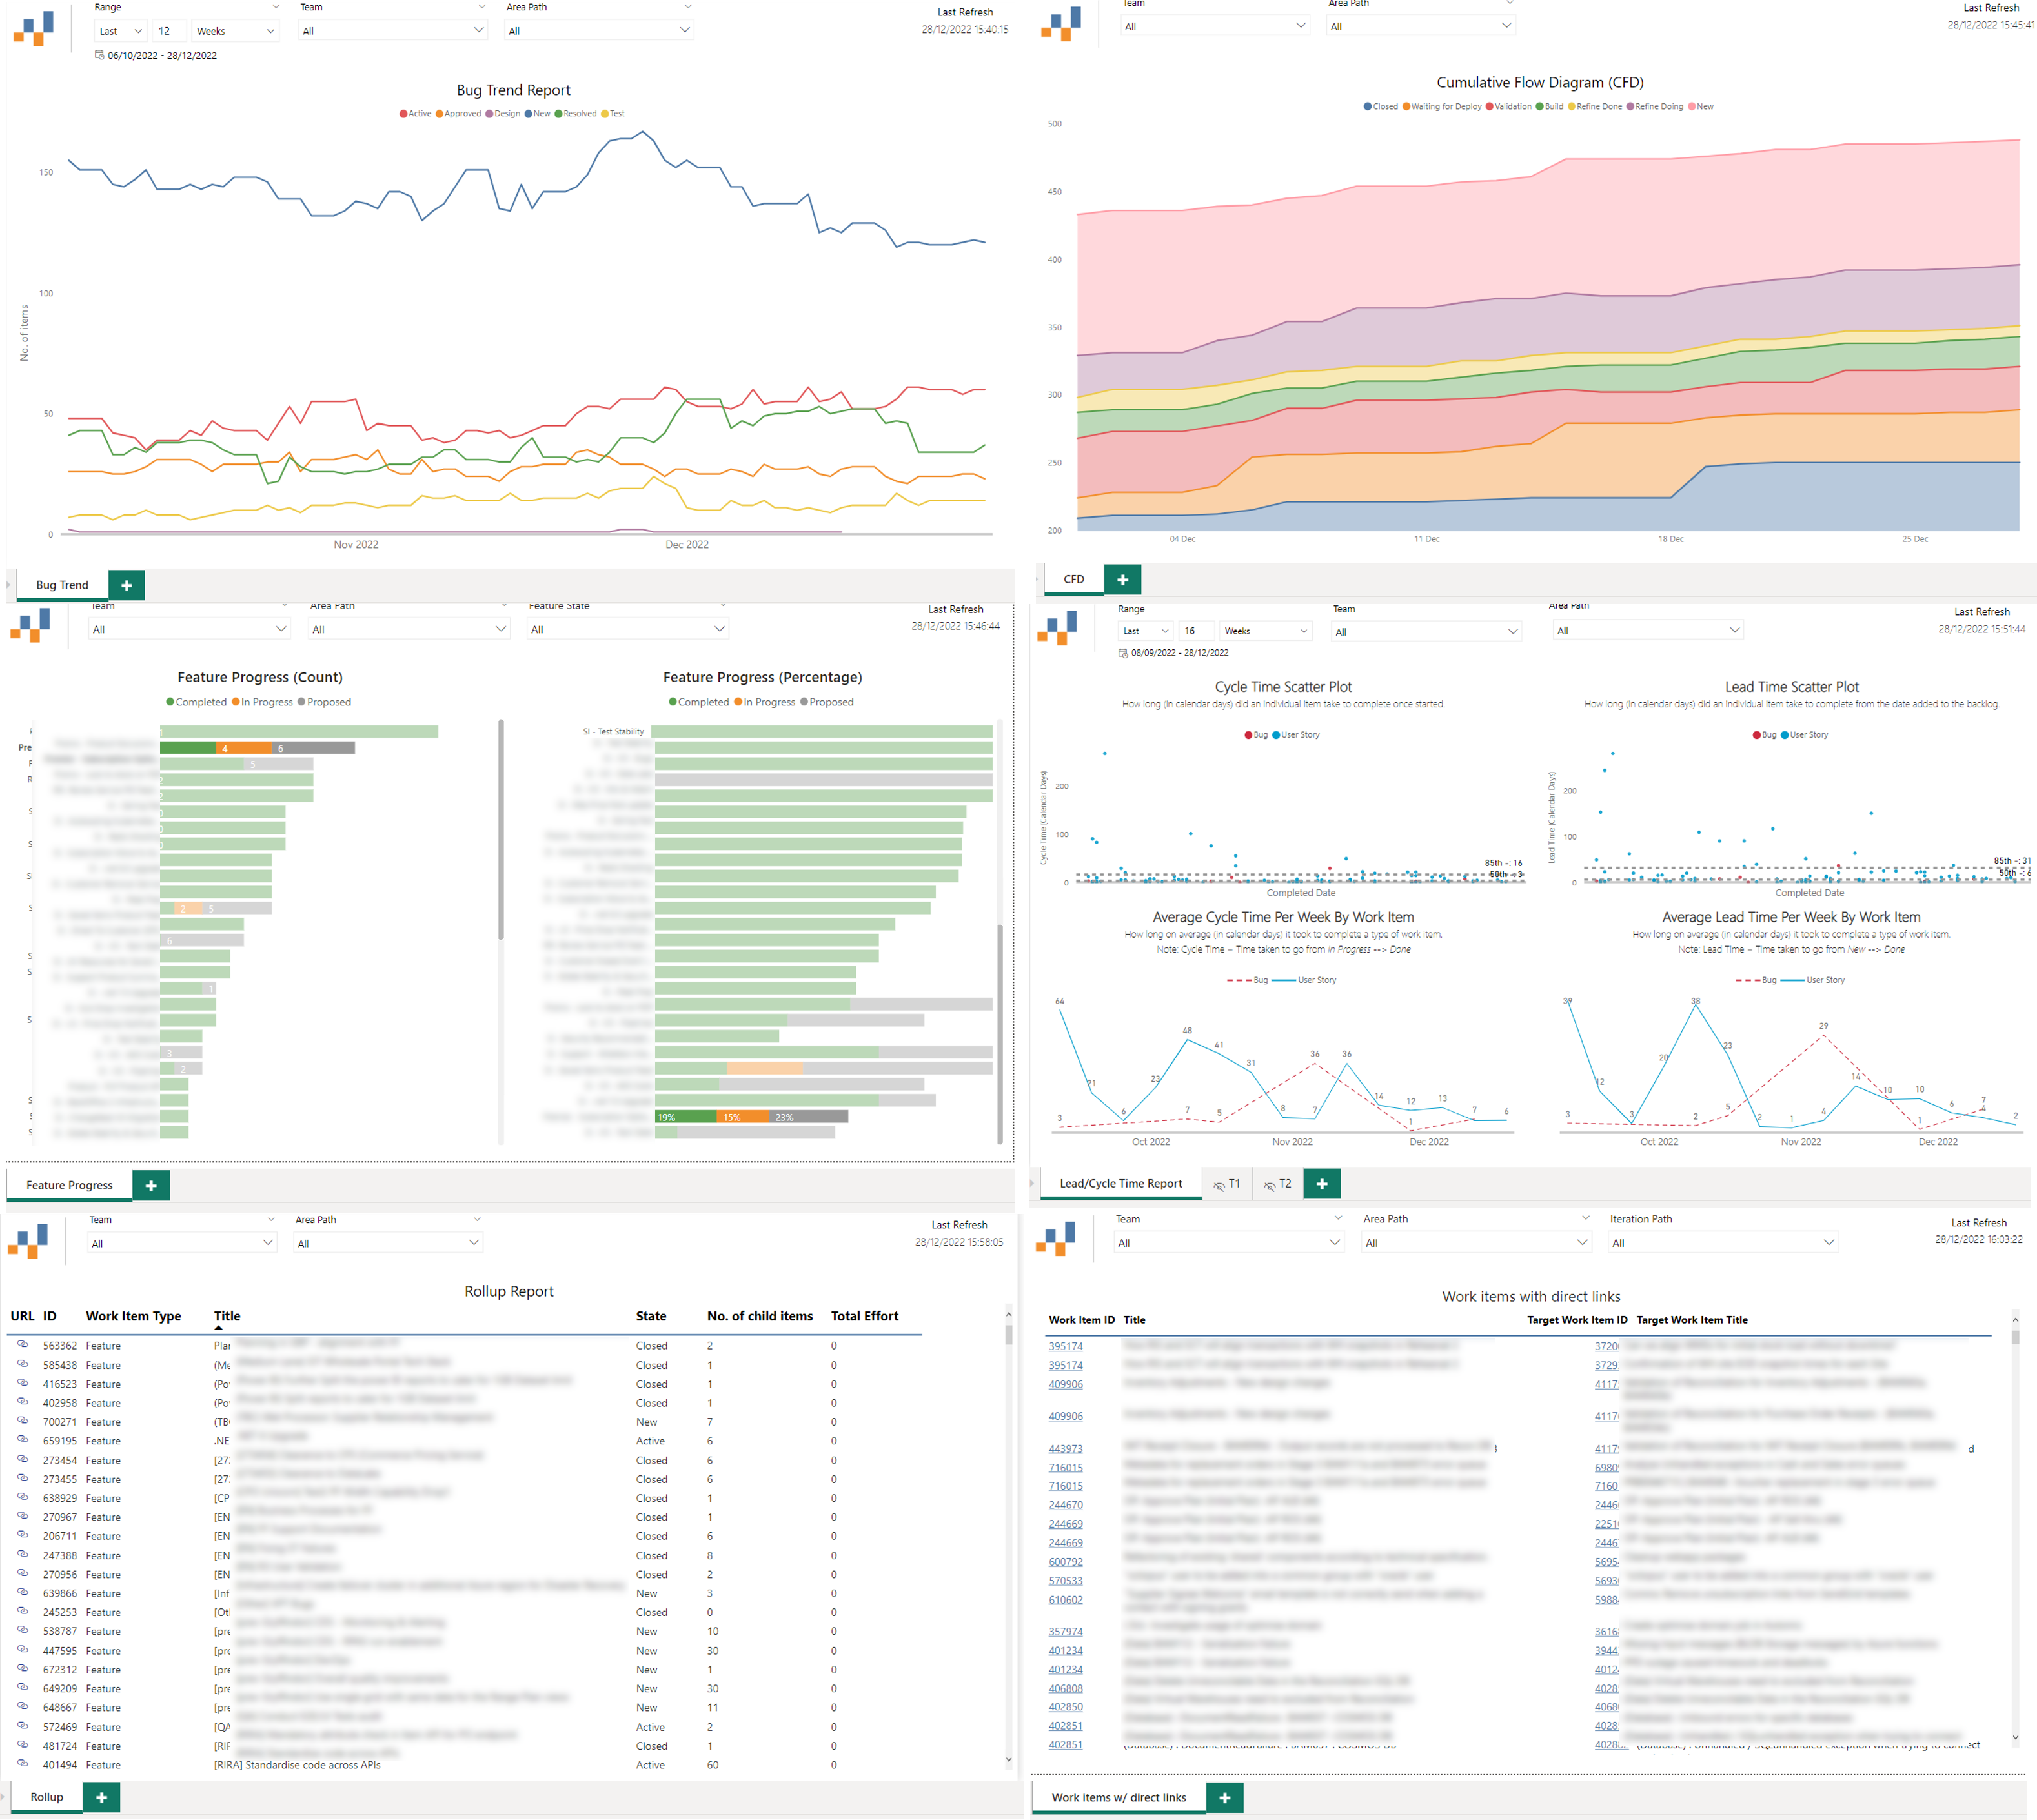
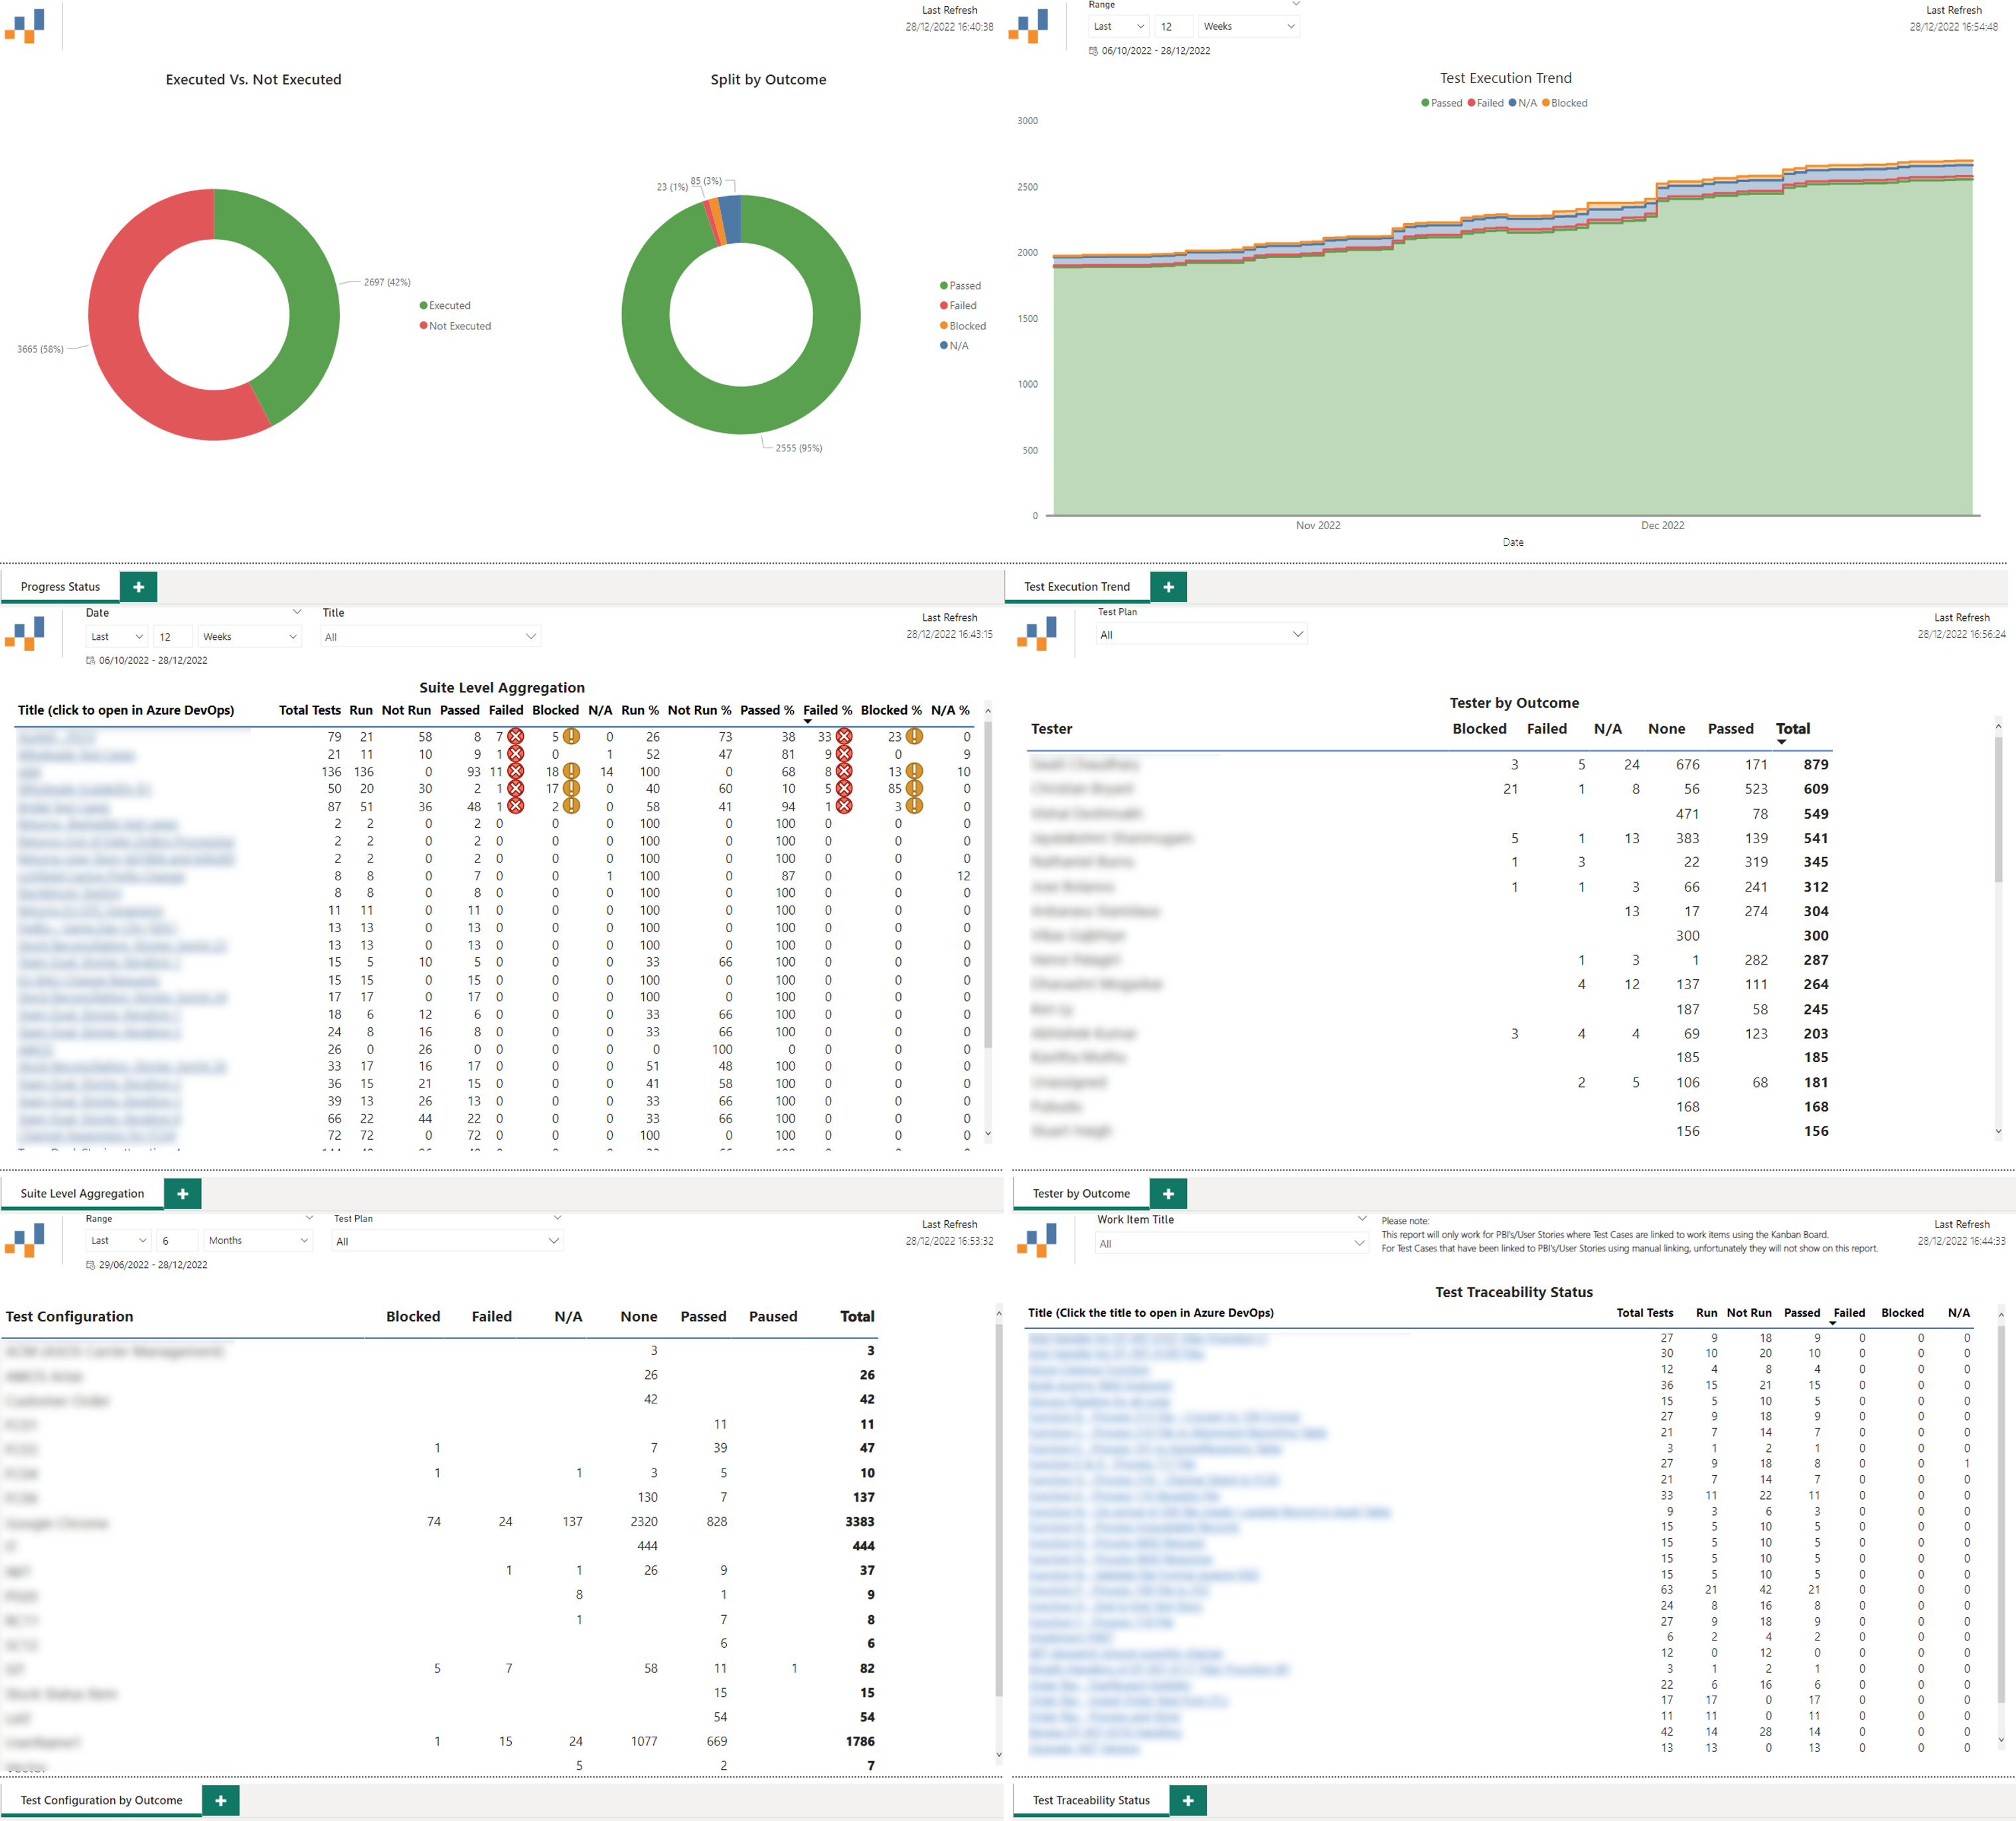
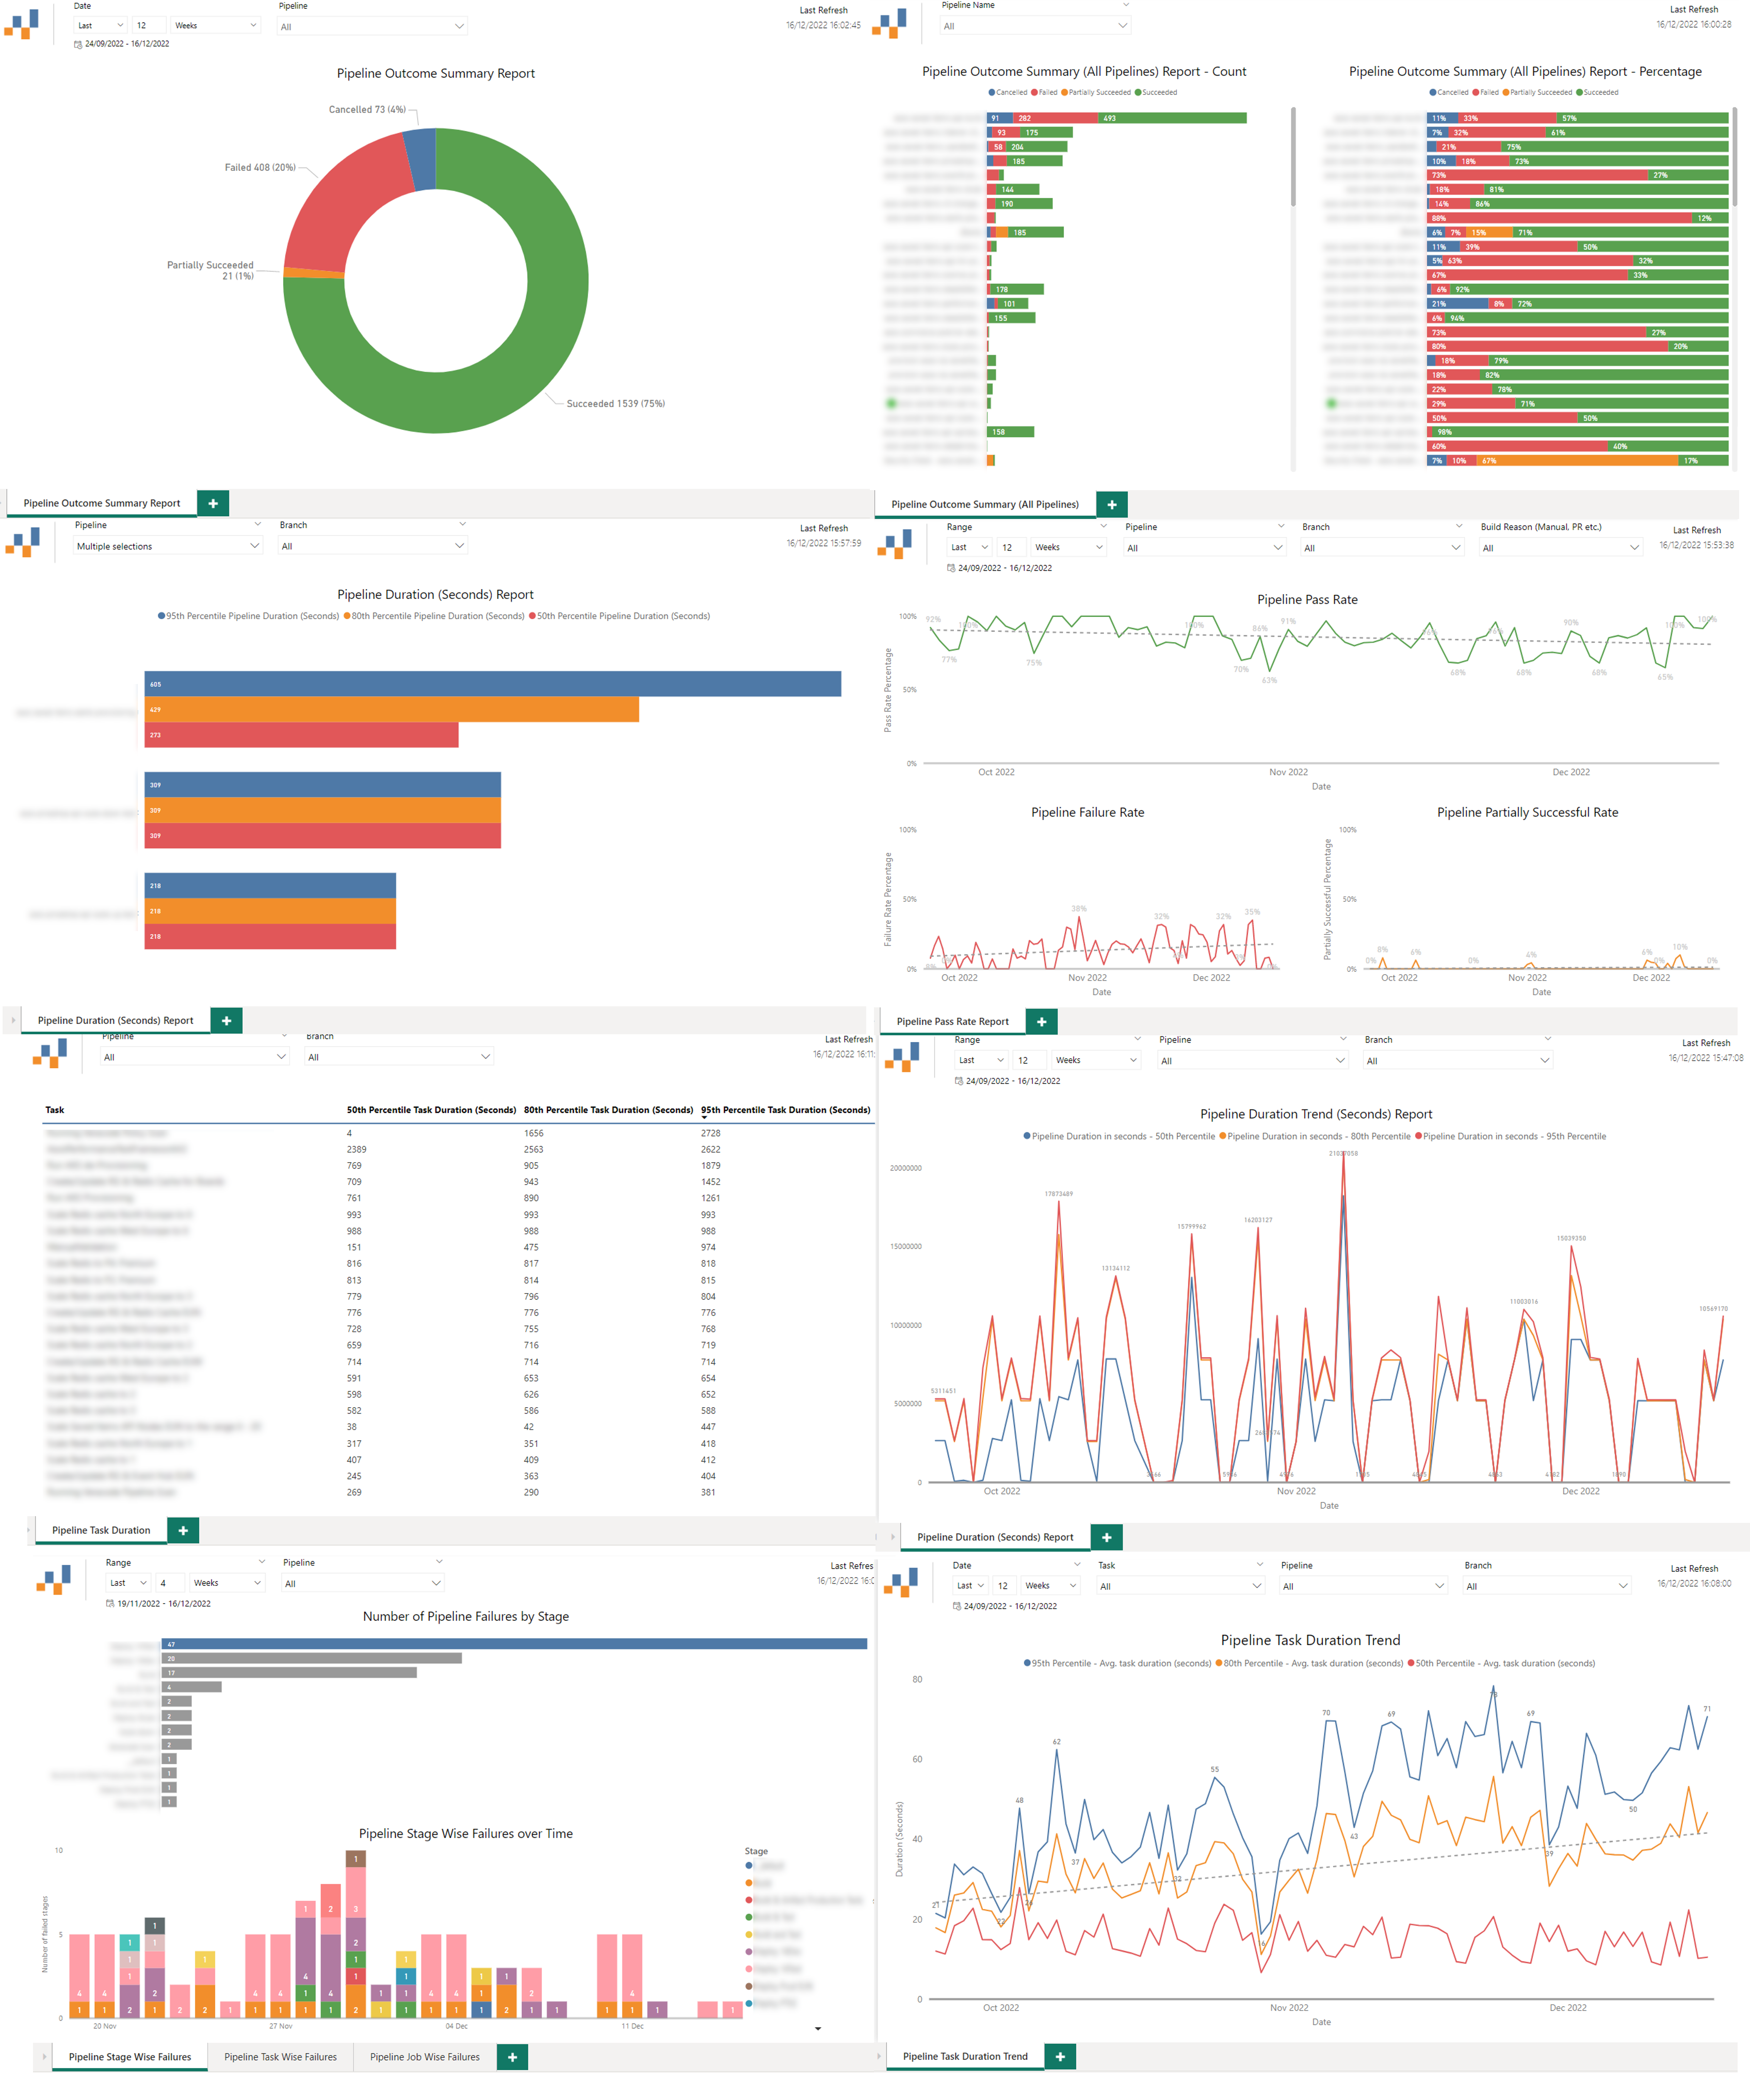
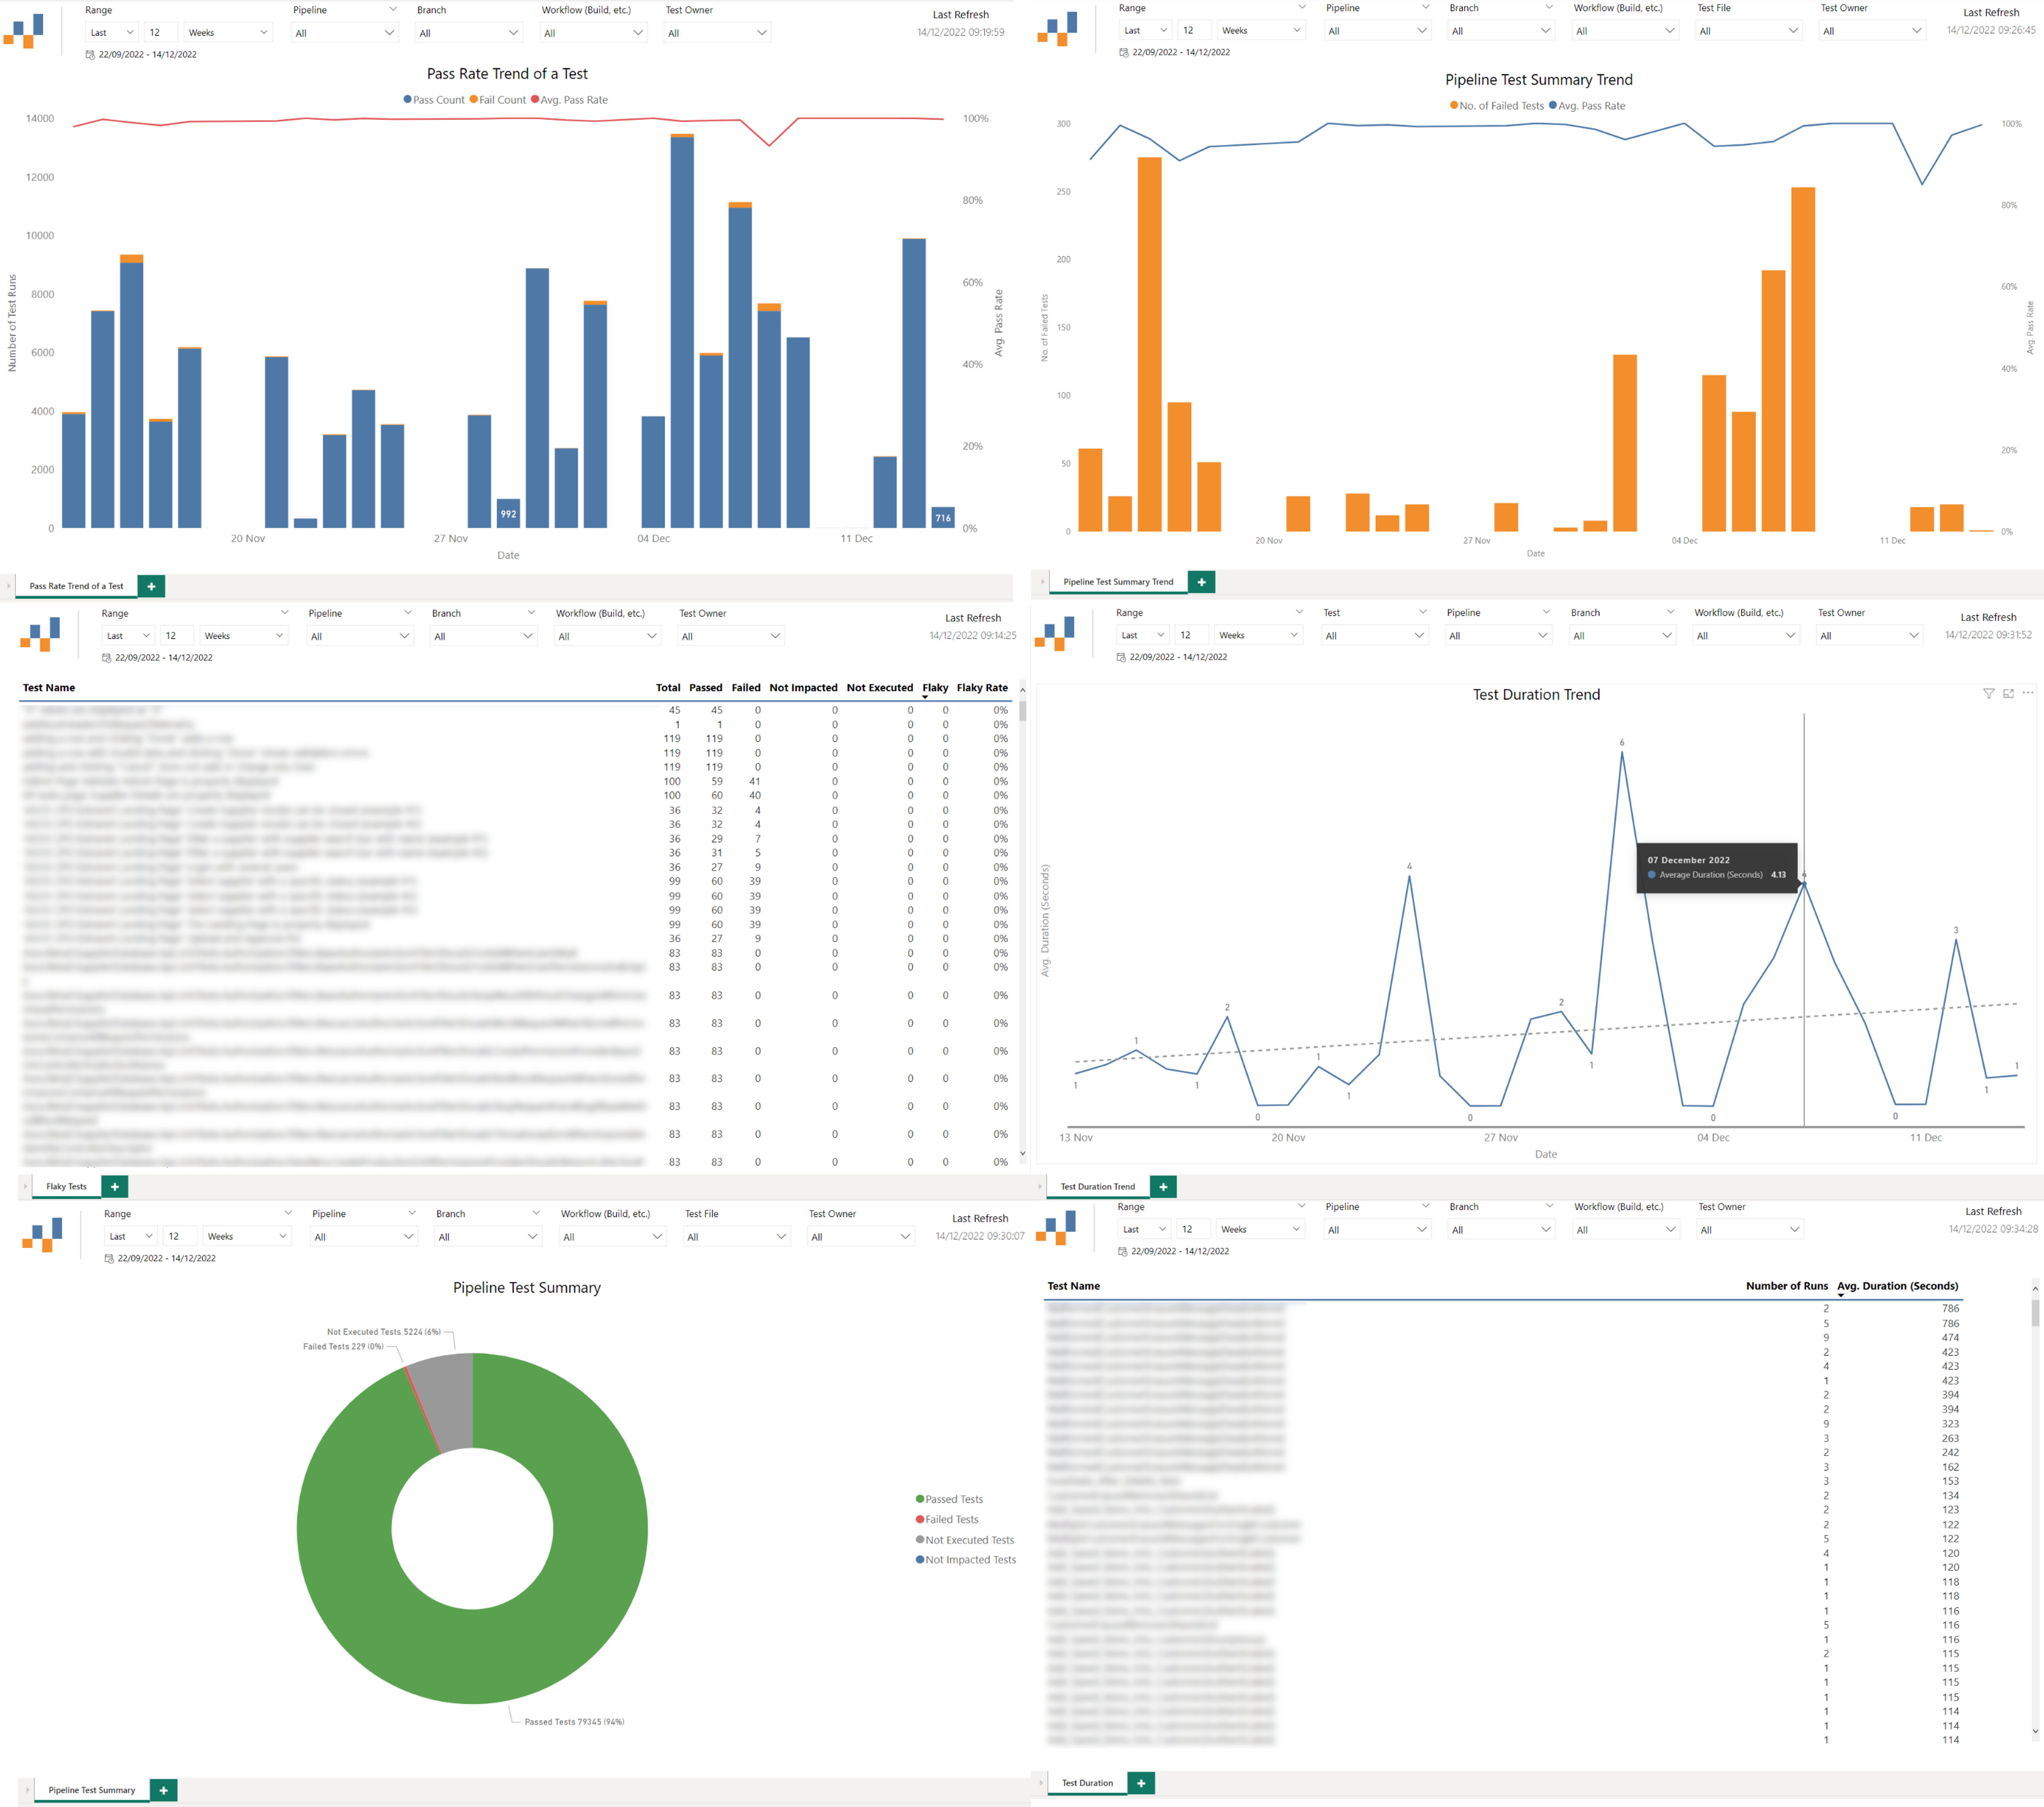
A collection of Power BI templates for all of the sample Azure DevOps OData Power BI reports provided by Microsoft for you to visualise your Azure DevOps, Azure DevOps Server and/or TFS data. This way you can save time, download the respective template(s), enter your organization and project details then visualize your data.
- Make sure you have the latest version of Power BI Desktop
- Download your chosen template(s):
- Open the .pbit file
- Select http/https (only choose http if your Azure DevOps Server is HTTP)
- Add the Analytics / Azure DevOps Server URL - for Azure DevOps services enter 'analytics.dev.azure.com' / for Azure DevOps Server enter your server details
- Add your organization and project name
Don't confuse the team name with the project name, a common mistake. If the URL you use is "http://dev.azure.com/Microsoft-UK/AzureDevOpsTeam/Database", then Microsoft-UK is the Organization Name, AzureDevOpsTeam is the Project name, Database is the team name.
- It should then look something like this:
Azure DevOps Services:
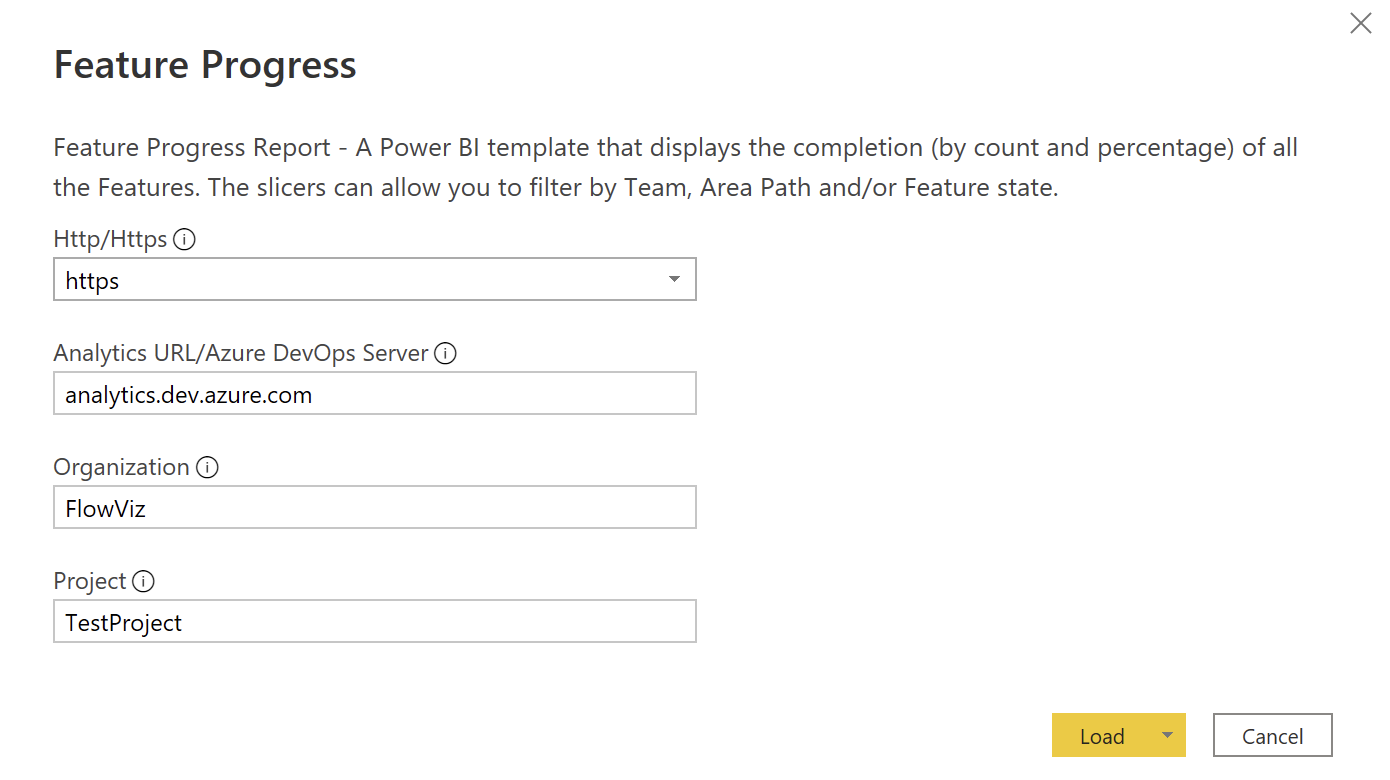
Azure DevOps Server:
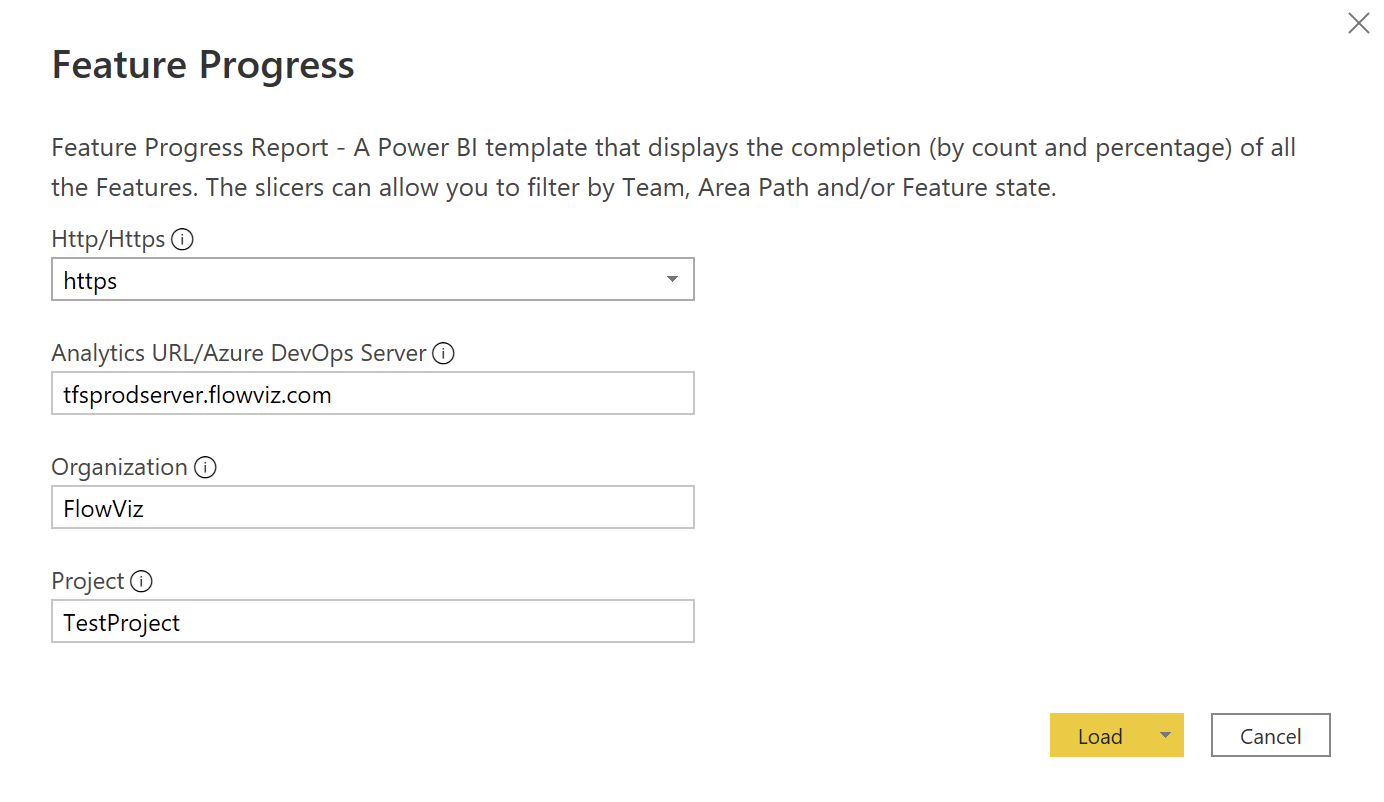
-
Hit 'Load'
-
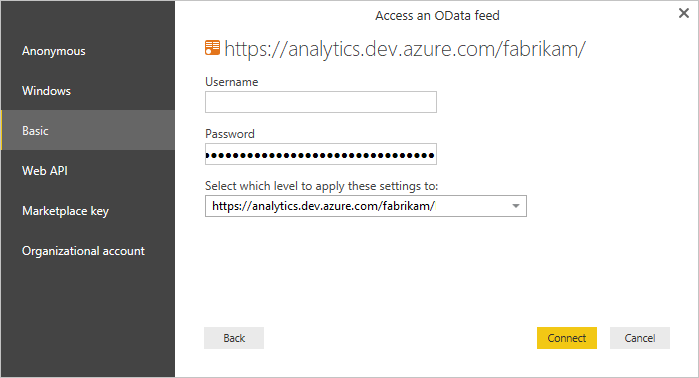
If you are prompted for a login, you can choose:
- 'Organizational' and enter your Organization email/password (if required) and sign in
- 'Basic' and use a Personal Access Token (PAT) to login, entering it in the password field (user can be left as blank - make sure it has 'Read' access to Analytics)
-
Once signed in hit 'Load' and wait for your charts to populate!