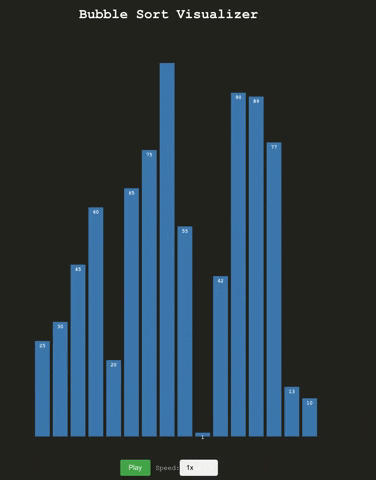
Algorithm Visualizer is an interactive tool designed to demonstrate the Bubble Sort algorithm in action. This project leverages modern web technologies to provide a visually rich and educational experience for those interested in understanding sorting techniques.
- React: Powers the interactive user interface.
- JavaScript: Implements the core logic of the Bubble Sort algorithm.
- Bootstrap: Used for styling and responsive design.
- D3.js: Enables dynamic data visualization with interactive data bars.
- Dynamic Visualization: Watch the Bubble Sort algorithm come to life with each step visualized in real-time.
- Interactive Elements: Engage with the algorithm by adjusting the data set and speed of the visualization.
- Responsive Design: Enjoy a seamless experience across various devices and screen sizes.