The project focus is on understanding how species are distributed along topographical gradients in tropical forests
- Install R
- Install rStudio
- git clone repo
- install packages
- Run code scripts
- Enjoy!
Variation among tree species in their environmental tolerances can contribute to species coexistence through niche partitioning. Topographical distributions of tropical tree species have long been associated with local soil water requirements, but clear evidence for traits influencing these patterns is not forthcoming. Decreasing water availability at higher elevations appears to impose an upper barrier to many tree species distributions, but factors mediating lower elevational limits remain unresolved. We show that water inundation episodes constrain species distributions at lower elevational gradients in tropical forests. Estimates of species-specific seedling responses to water inundation accurately predicted adult tree distributions in a large forest dynamics plot. Water inundation in low elevation areas increased seedling mortality of tree species with low wood densities, while having relatively little effect on species with higher wood densities. Our results suggest that the resistance of higher wood density species on low lying nutrient-rich alluvial forest to short periods of inundation allows high wood density species to occur on nutrient rich zones commonly associated with fast growing low wood density species. Analysis of adult distributions of 41 dipterocarp species in 178 ha of forest confirms that higher wood density species occur across the elevation gradient, while lower wood density species occur predominantly at lower elevations. Thus, differential seedling responses to water inundation captures larger scale filtering processes that determine adult topographical distributions of species. In view of this, increasingly variable rainfall amplitude in the region is likely to affect the spatial structure, species composition, and diversity of future forests.
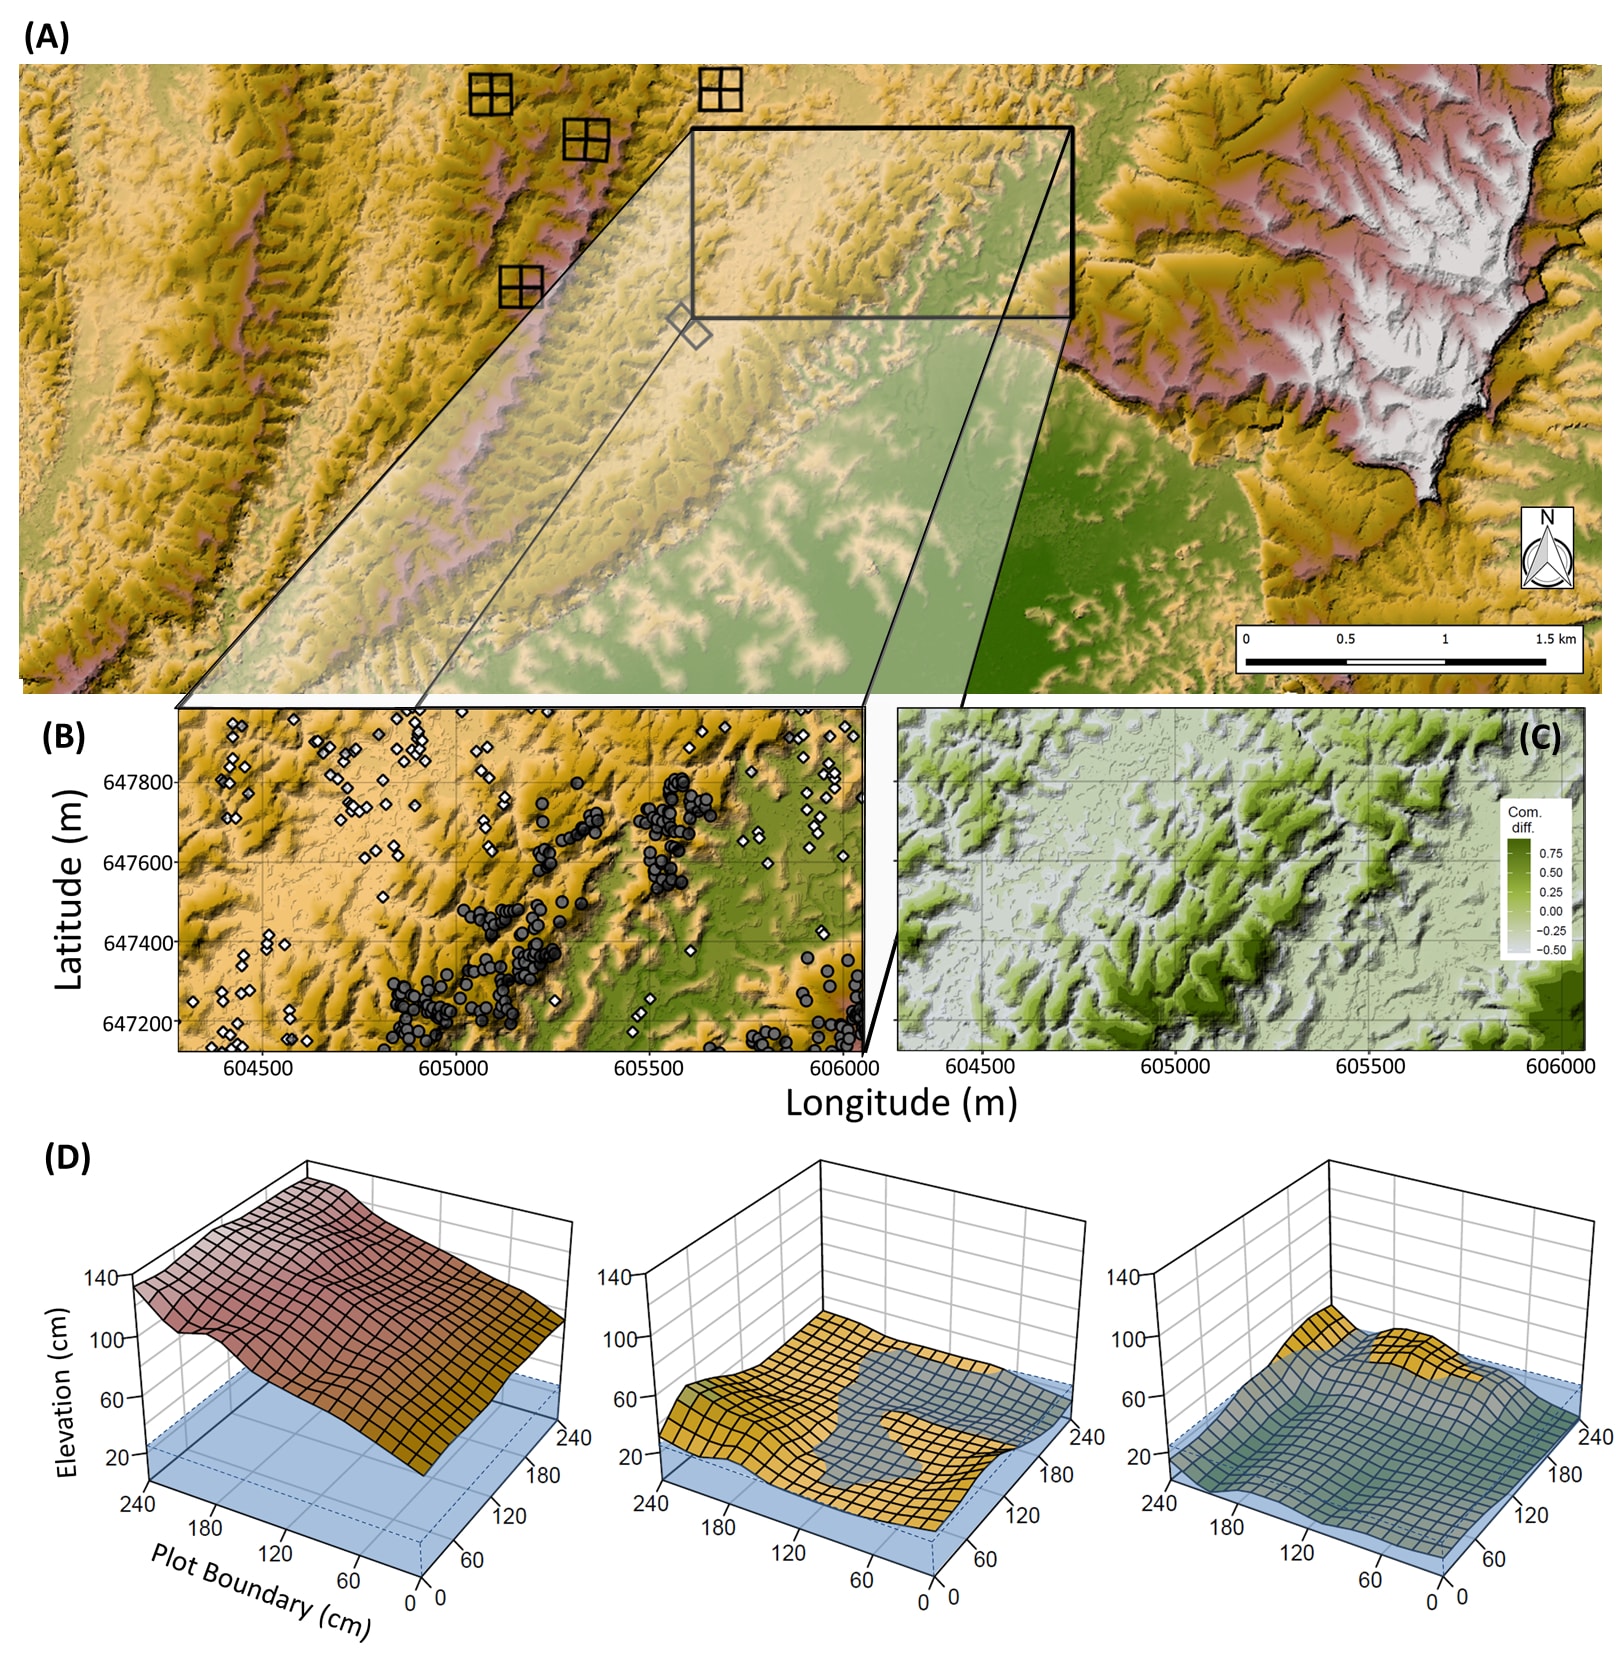
Figure 1 | Macro to micro topographical variation within Sepilok Forest Reserve, and community compositional variation at the macro scale. Topographical digital terrain model of 3375 ha (ca. 75%) of SFR (A) , with the 160 ha forest plot outlined and the distribution of the four 4 ha plots (and one 2 ha plot) for analysis. (B) The distribution of two example species, Shorea leprosula (white, diamond) and S. beccariana (grey, circle), indicating partitioning along topographical gradients within the 160 ha plot. (C) Dissimilarity in dipterocarp community compositions reflected by colour variations across the 160 ha plot, extracted from axis 1 of a non-metric multi-dimensional scaling analysis of 12 elevational bands. (D) Micro-topographical variation within three example plots, mean water inundation height expressed as the transparent blue.
- Sixteen dipterocarp (Dipterocarpaceae) tree species were tested for their tolerances to flooding on lowland alluvial flats in Sepilok Forest Reserve. The Dipterocarpaceae contributes around 50% of canopy trees in the lowland tropical forests of Borneo. Rainfall peaks from November to February (Fig. S2), during which time ephemeral shallow pools can form in the alluvial valley bottoms of lowland forests creating a heterogeneous landscape. We planted 2048 seedlings within 32 plots over the micro-topographical gradient of the alluvial zone. Seedlings were 3-4 months old when planted, at a stage shortly after loss of cotyledons and emergence of the first true leaves. Seedlings were censused every three months for one year. We mapped micro-topography using a laser lever at all plots and used mean flooding depth during the wetter period of the year (November to February) as a relative baseline for comparison among plots. We determined soil pH, and soil texture at the plot level. During periods of water inundation, depth of inundation was measured for each individual seedling.
- All adults dipterocarps in a 160 ha plot and four and a half 4 ha plots were mapped and tagged, with distributions being overlaid on a digital terrain model. For the main 160 ha forest plot, we used a quadratic equation to model the probability of occurrence of each species along elevation and hydrological gradients. Integrated Nested Laplace Approximation and Stochastic Partial Differential Equations (INLA-SPDE) were used for the analysis to account for spatial auto-correlation in the data using a matern correlation function. The conditional predictive ordinate was used to select the most parsimonious model.
- Wood density measurements were determined from the global wood density database31. We combined the two analyses presented to understand the relationship between seedling mortality, adult distribution and community composition. Flooding sensitivity was calculated for each species by subtracting the probability of mortality of seedlings that were not flooded from those that were flooded (the statistic: absolute risk increase)32. The maximum peak of the quadratic equation describing the relationship with elevation was used to assign where adults of each species were most likely to be found along the elevation gradient. We ran regressions and ANOVA models weighted with species abundances to investigate the effects of wood density and flooding sensitivity on adult distributions (Fig. 2).
- We tested the predictions of statistical model against the median elevation of 13 co-occurring species in the 18 ha of forest outside the 160 ha plot. Each 4 ha forest plot was at least 260 m apart, and we suggest plots are independent. The predicted elevations of each species from our statistical model were used to explain the variation in the median elevation a species was found at in these areas, weighted by the abundance. We calculated the r2 for the weighted mean elevation (n = 13) and for all individuals (n = 304).
- Traditional ideas on wood density distribution throughout the landscape combined with our results suggests that wood density is distributed as a wedge shape along elevation distributions. To test this hypothesis we carried out a quantile regression on all the plot data we have (178 ha) for adult dipterocarps (species = 36). We convert all plots into a ¼ ha lattice of subplots, with the mean value of wood density, and elevation for each ha (n = 720 quater ha quadrats).
- Community similarity map (Fig. 1c) used the same 12 elevation bands as above. Non-metric multidimensional scaling was used to calculate the dissimilarity of each elevation band using all individual in the plot (species = 42), and axis 1 was used to create the map.
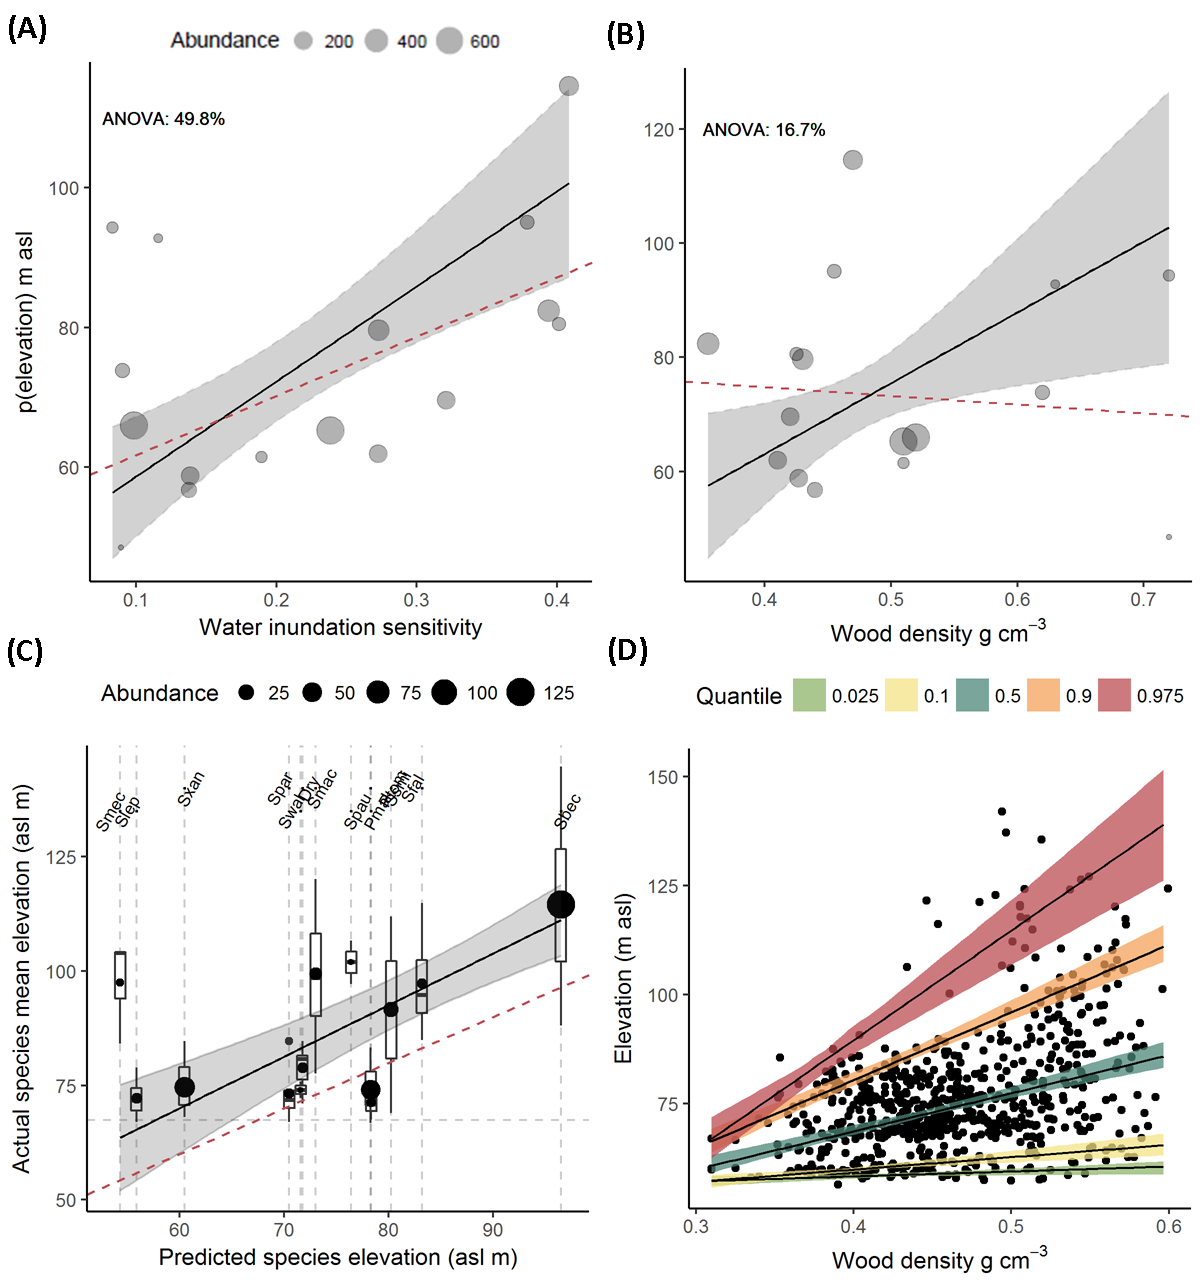
Figure 3 | Weighted regression inundation sensitivity (A) and wood density (B) against the adult elevation distribution (m); relationship between the predicted distribution and actual distribution (C); and wood density distribution (D). Species were weighted based on their abundances with the size of the points corresponding to the abundance. Lines and 95% Confidence intervals were predicted from the model. Sixteen species were included in the analysis. Red dashed lines indicate the univariate analysis. Percentage variance for each variable from an ANOVA test. Using the mode calibrated in (A & B) , for predictions of elevation and mean species elevation (C). Black points indicate the elevation a species and size reflects the abundance. Box plots show the distribution of the species. Species acronyms reflect the – dashed lines show the red dashed line indicates the 1:1 relationship. (D) quantile regression (0.025, 0.1, 0.5, 0.9, 0.975) typical wood density vs. typical elevation (m asl) of ¼ ha plots (n = 675).
R 3.4.4 "Someone to Learn On"
- lme4
- ggplot2
- quantreg
- car
- arm
Please feel free to clone and play with the data sets and create new analysis files and graphs. If you are interested in collaborating on these data and a analysis submit a pull request and lets discuss
James A. Margrove, Christopher D. Philipson, Robert Bagchi, Colin J. Maycock, Eyen Khoo, Nora Gallarotti, Reuben Nilus, David F.R.P. Burslem, and Jaboury Ghazoul