There are 2 source files, they are both in src folder:
signals_sum.F90- file responsible for changing given function into the sum of signalsnoise_deleting.F90- file responsible for second part of the task
There is also a Makefile in src folder, which contains following commands:
build
run_sum
run_filter
clean
In order to run the project, you need to have Intel Fortran Compiler (ifort) installed.
-
Clone the repository
-
Go to
srcdirectory and enter following command in terminal:make build. This command allows you to build project - bothsignals_sumandnoise_deletefiles will be built. -
To run first part of the task, enter following command in terminal:
make run_sum. -
To run second part of the task, enter following command in terminal:
make run_filter. -
If you type either
make run_sumcommand ormake run_filtercommand, results for both of them will be stored inresdirectory. If you want to do it, delete previous ones from this directory, as they won't be overwritten, but additional lines will be added to them.
Changing signal into the sum of signals.
I used following function:
x = sin(2 ∗ π ∗ t ∗ 200) + 2 ∗ sin(2 ∗ π ∗ t ∗ 400)
Following image represents the result of this task:
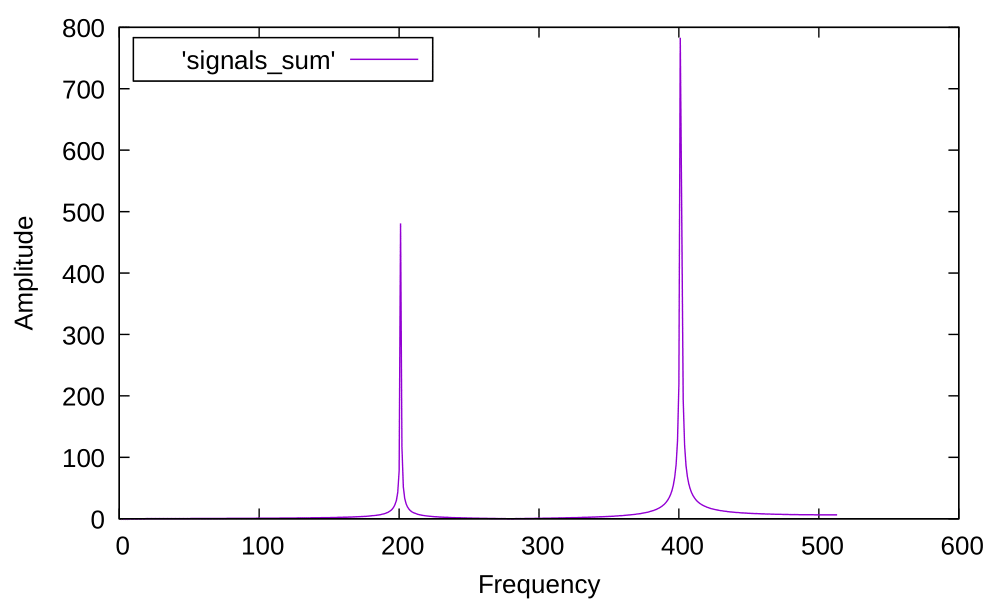 There are two bars on the plot that represent maximum amplitude for given frequency.
For function:
There are two bars on the plot that represent maximum amplitude for given frequency.
For function: x = sin(2 ∗ π ∗ t ∗ 200) + 2 ∗ sin(2 ∗ π ∗ t ∗ 400) there are two components, so there are two bars as well.
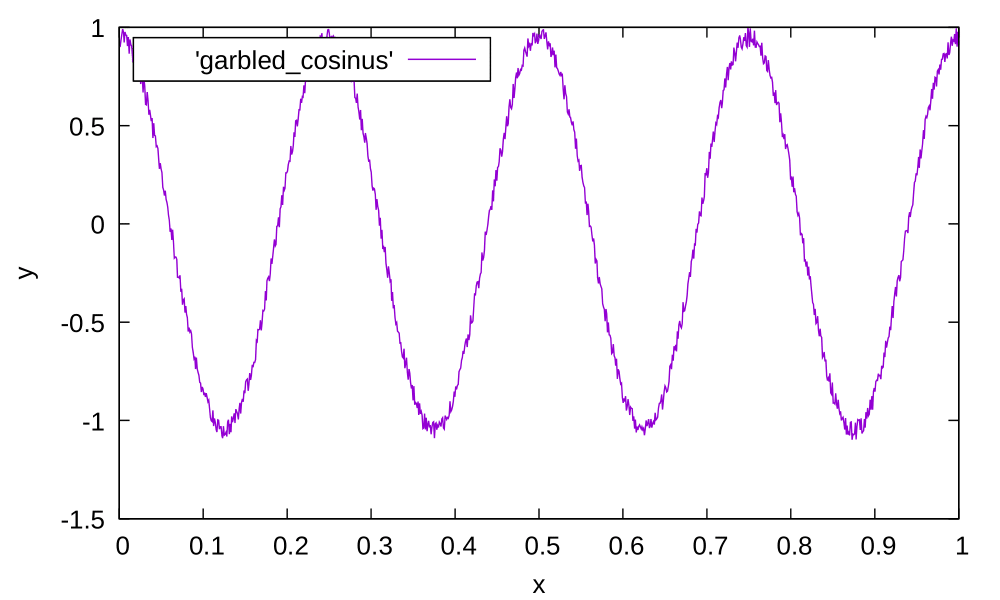
Next task was to create garbled cosinus function.
Mine was:
cos(2 * pi * t * 4) + (random_noise - 1) * 0.1 where (random_noise - 1) * 0.1 is just some small distortion added to the cosinus.
Following image presents this garbled cosinus:
Next part of the task was to perform Fourier Transform on the signal.
Following image presents results of this operation:
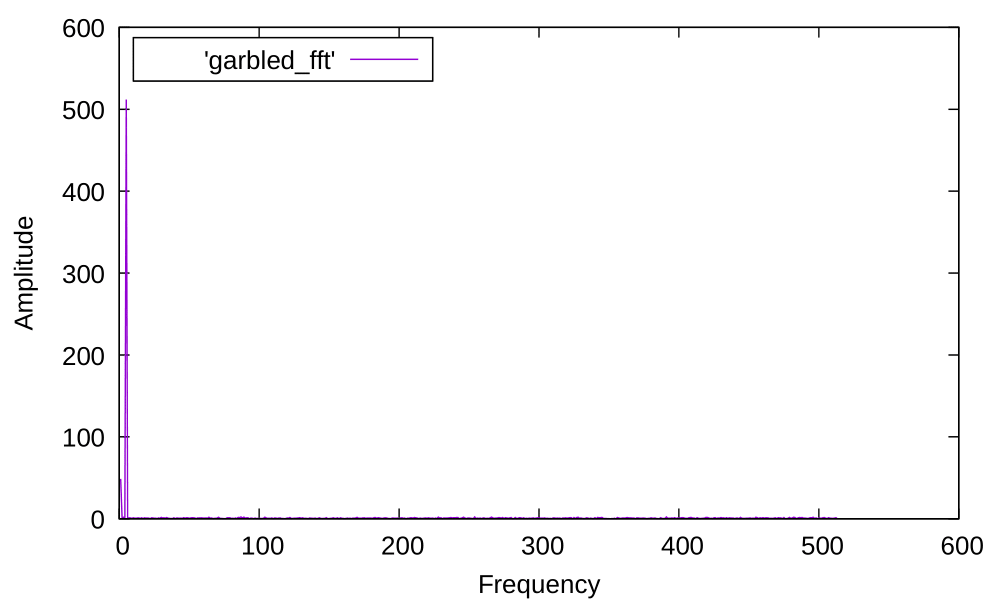
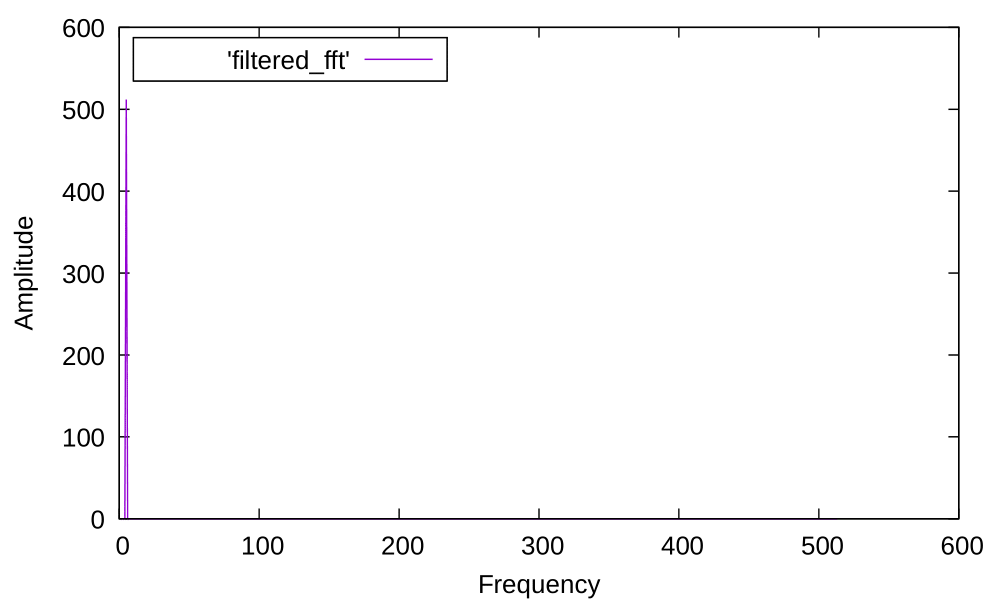
Then I had to filter given fourier transform - delete values for which the amplitude was smaller than 50.
Following image presents results of this operation:
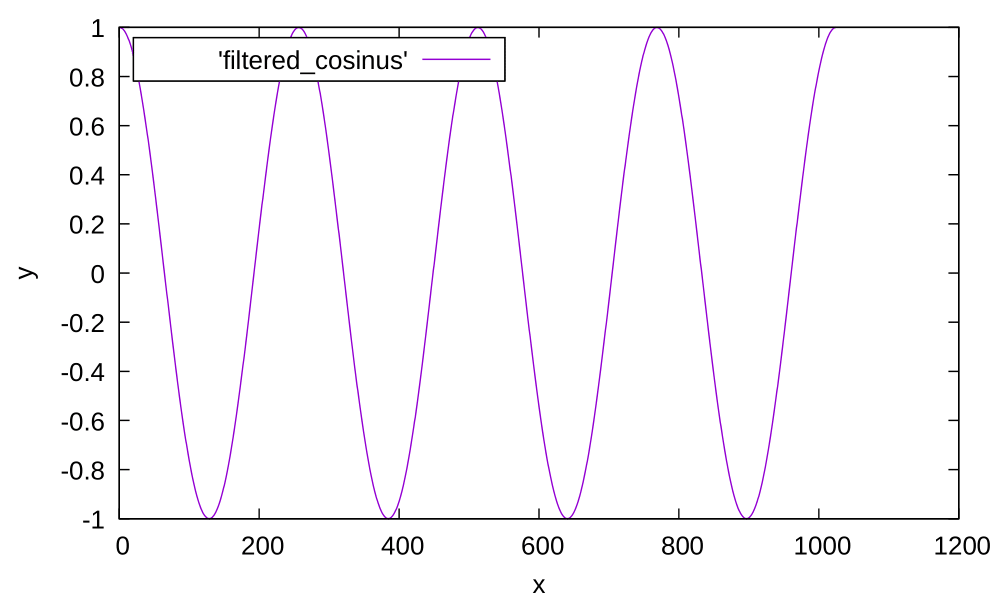
Final part of the task was to perform Inverse Fourier Transform on the part that was filtered.
Following image presents results of this operation: