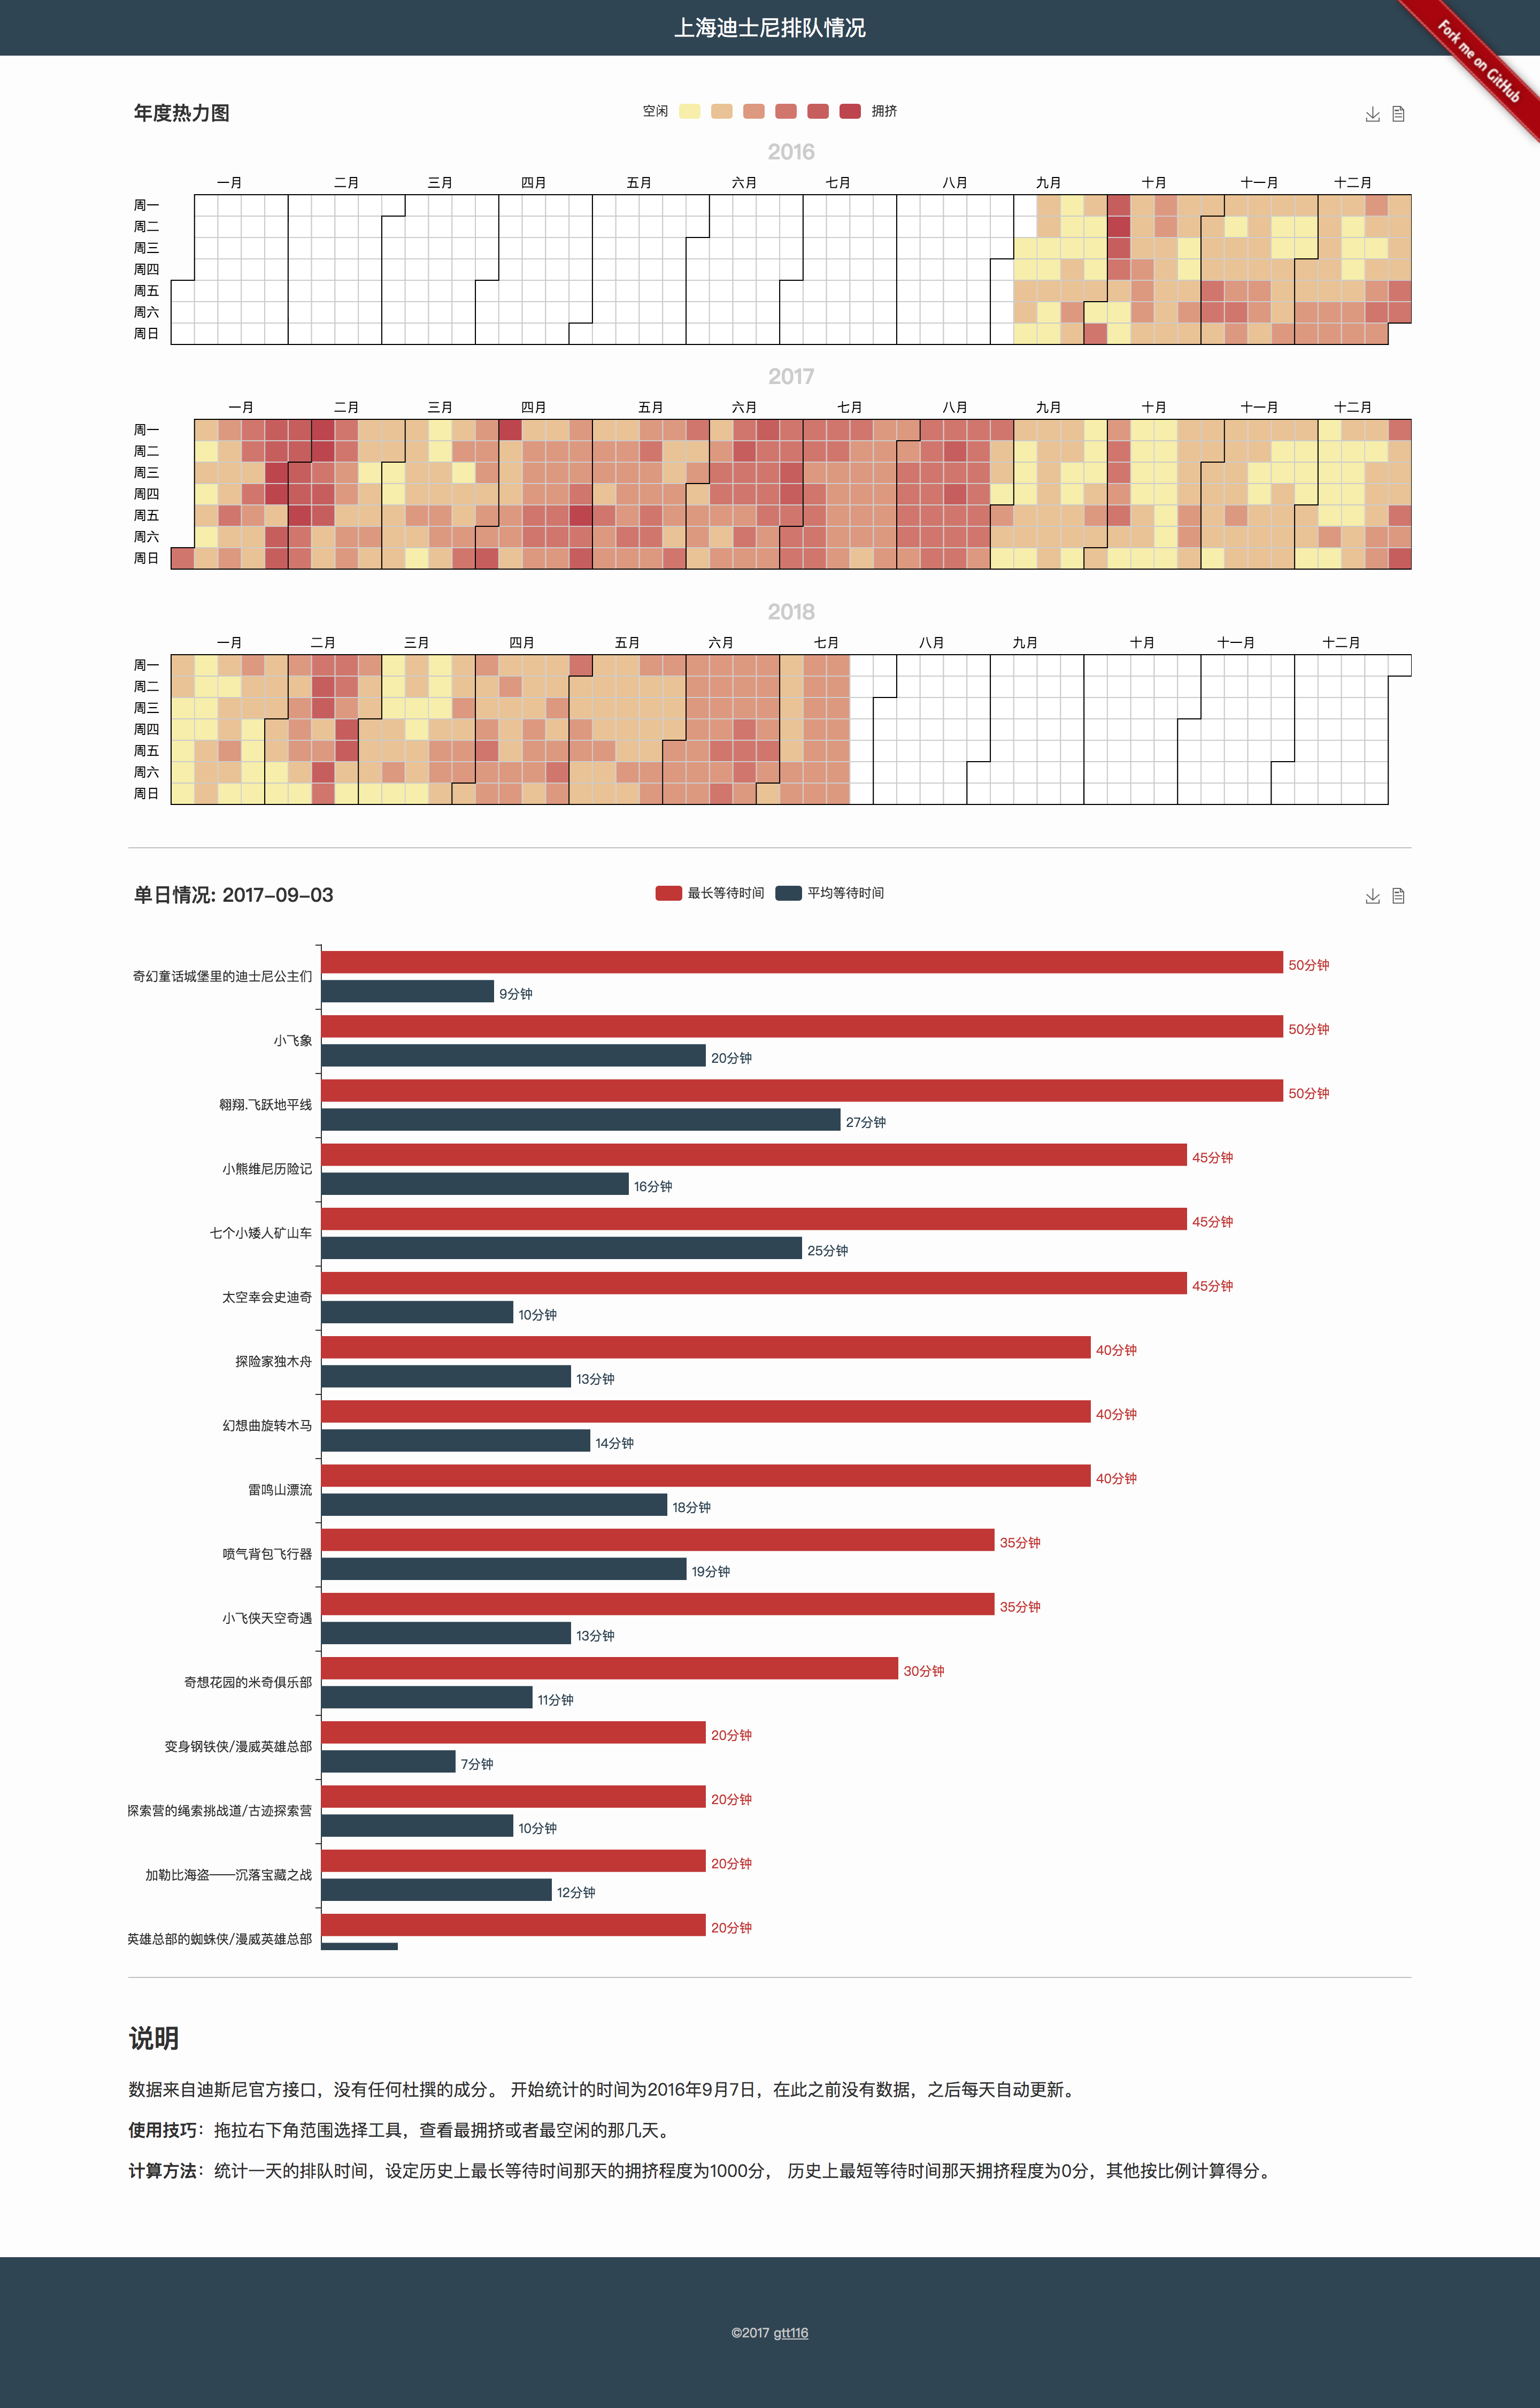
We all love Shanghai Disneyland, but the long long long waiting queue is going to kill us. So I need a better place to find which attraction is the lightest.
Also I want to find out which season is the best choice to travel to Disneyland, the statistic will give me the answer.
- install influxdb
- install grafana
$ git clone git://github.com/gtt116/wait4disney
$ cd wait4disney
$ pip install -r requirements.txt
$ pip install -e .
$ disney-fetch        # This command will fetch data from disney server and insert into influxdb.
$ disney-publish day  # This command will publish daily report.
$ disney-publish year # This command will publish yearly report.
All config items like report path, influxdb username locate at disney/config.py, please feel
free to change it to meet your environment.
You can setup a crontab job to update disney waiting queue every minute.
The grafana dashboard template locates at wait4disney/doc/grafana.json, you can
import it to give a try.
To generate heatmap follow these steps:
python web.py > disney.json
python -mSimpleHTTPServer
Then open your favourite web browser to http://127.0.0.1:8000/index.html. you can also setup a crontab to generate report every day.
