Visualize data from OData data sources with Grafana.
This is a Grafana data source for showing data from OData V4 compliant data sources.
It was originally developed for internal purposes and is now made available to the open source community.
Open Grafana and go to Configuration / Data Sources. Click Add data source button.
Enter OData into the filter input field and select the OData Data Source.
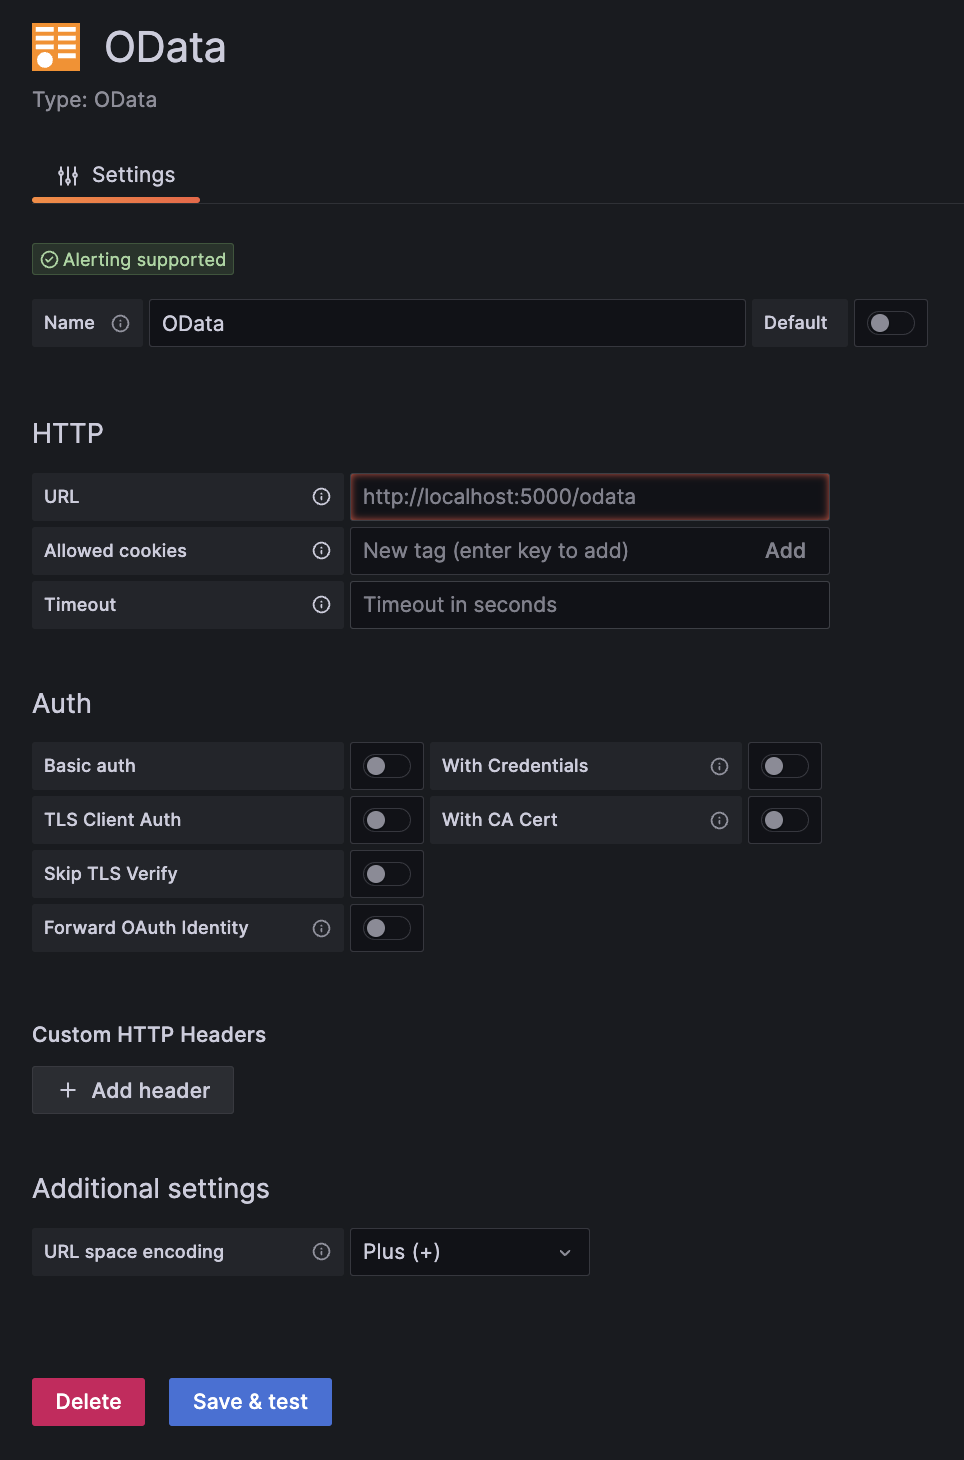
Provide the URL of your OData Service Root and click Save & test to test the connection.
The URL space encoding setting can be used to specify the encoding of spaces in URLs. Percent uses %20 (see RFC
3986), while Plus uses + (used in form data). E.g. $filter=value%20EQ%201 vs. $filter=value+EQ+1.
Add other connection settings, such as auth settings, as necessary.
To use the data source, create a new query and select the newly created OData data source.
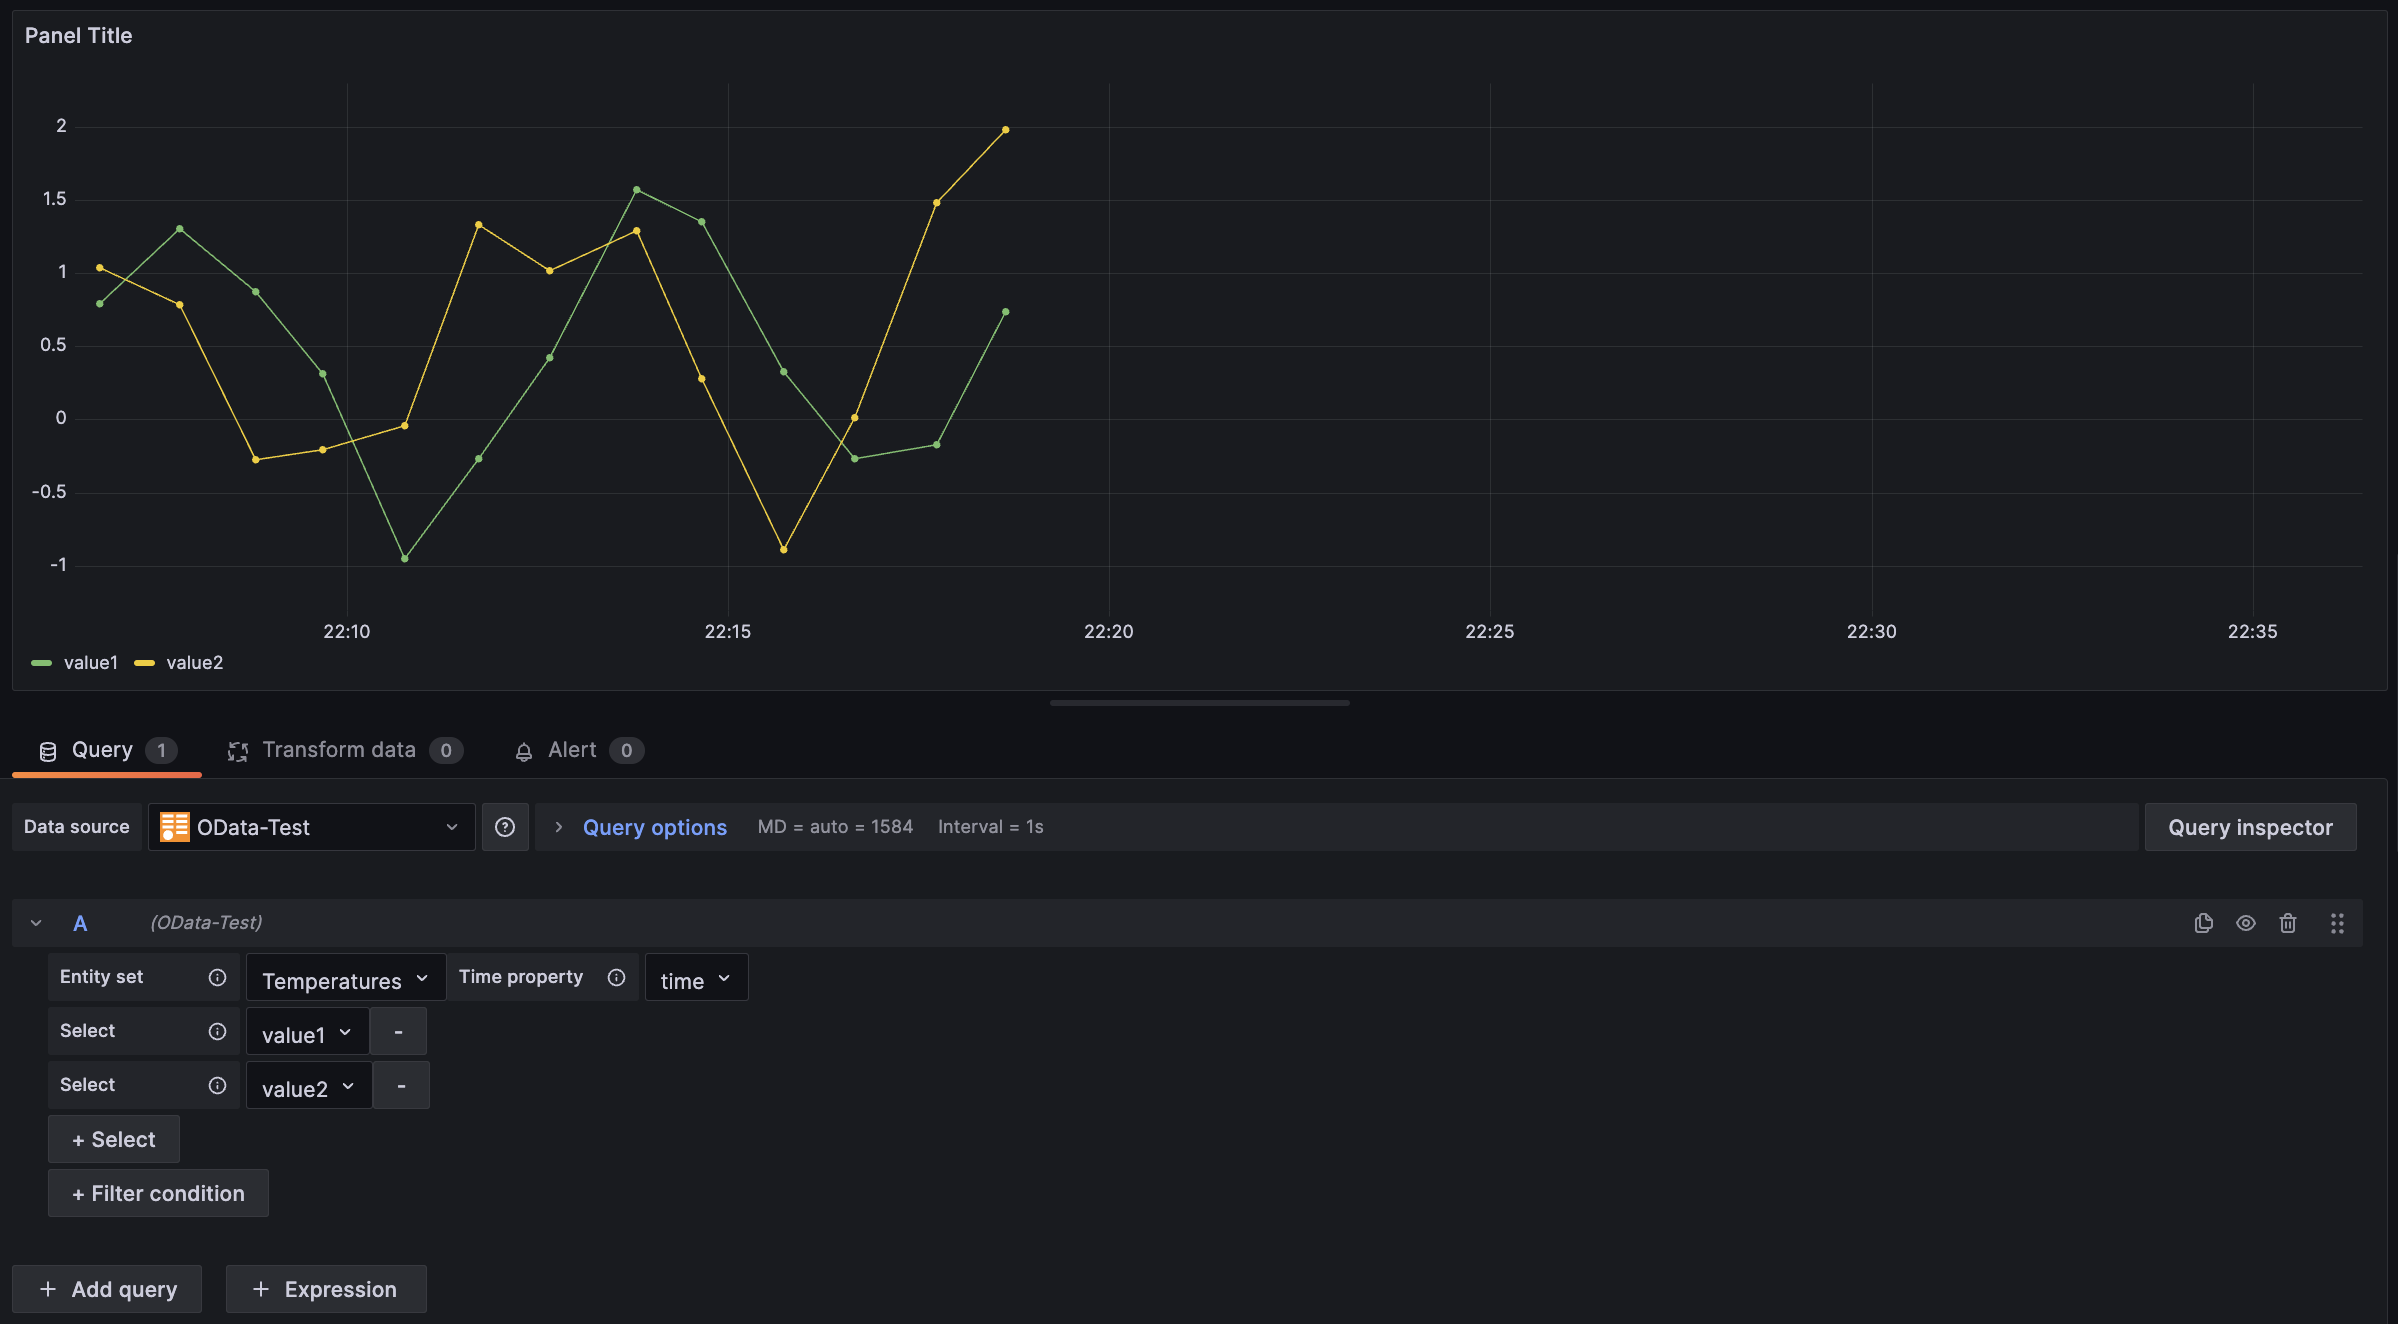
Choose an entity set, an appropriate time property, and the metric you want to view. Now you should be able to see data for the selected time frame.
- Grafana - the open source analytics & monitoring solution for many data sources
- Build a Grafana data source plugin - a tutorial that explains how to develop your own data source plugin.
- OData - the ISO/IEC approved, OASIS standard for building and using data-driven RESTful APIs
This project is maintained by d-velop but is looking for contributors. If you consider contributing to this project please read CONTRIBUTING and DEVELOPING for details on how to get started.
Please read LICENSE for licensing information.