Visual Analytics project to analyze and discovery insights of video game sales in recent years, with the high-level API plotly.express.
Motivation: the video game industry currently (2021) has more than 3 billion active players and its market is worth more than $170 billion (BestTheNews). Therefore, it is worth analyzing some data on video game sales by platform and genre over the last 4 decades.
- Video games sales per release year
- Top 50 best-selling video games
- Video game sales grouped by platform
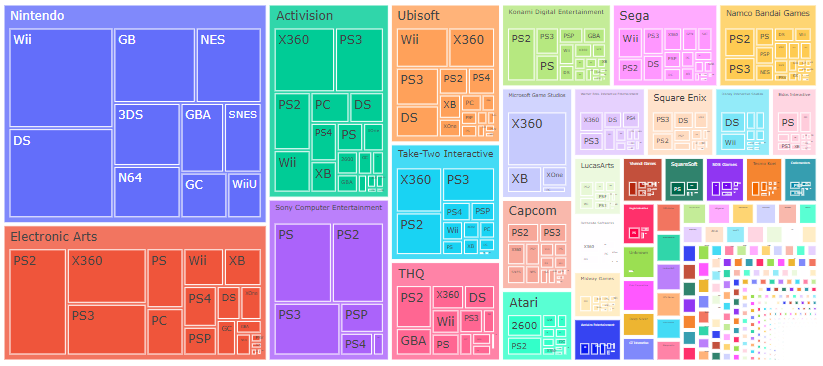
- Video game sales grouped by publisher
- Sales trends of top 10 publishers
- Distribution of video game sales
- Evolution of video game sales by genre
To view the DataViz, click on the link.
This dataset contains a list of video games with sales greater than 100,000 copies. Original data from Kaggle.
Fields include:
- Rank - Ranking of overall sales
- Name - The games name
- Platform - Platform of the games release (i.e. PC, PS4, etc.)
- Year - Year of the game's release
- Genre - Genre of the game
- Publisher - Publisher of the game
- Developer - Developer of the game
- Global_Sales - Total worldwide sales (in millions)
- The release year with the subsequent highest sales of video games was 2008. Keep in mind that for many of the games released later, sales have not been reported or are still selling.
- The best-selling game is Wii Sports with approximately 80M copies. Also, the best-selling video game company is Nintendo.
- The second best-selling game is GTA V, on 3 different platforms: PS3, PS4, Xbox 360.
- The 4 platforms that have contributed the most to video game sales are: PS2, PS3, X360 and Wii, closely followed by Nintendo DS and PS.
- As of 2013, the majority of video games sold were of the genres: Action, Role-Playing (RPG) and Adventure, closely followed by the genres: Sports and Shooter.
- Regarding the platforms that sold the most video games as of 2013, PlayStation (PS3, PS4 and PSV) is the clear winner, contributing approximately 40% of video games sold.
- The participation of games by gender is practically distributed uniformly by platform.
- Finally, how the video game genre trend has changed in each decade:
- In the 1980s, Platform games were the most played, with 32.5%, now (in the 2010s) they only represent 4.86%.
- Instead, the Action genre is the most famous now with a 25.4% share.
- The 1990s was one of the most balanced, where RPG games had more prominence (12.1%) and Platform games began to decline.
- In the 2000s it was when eSport games had their biggest boom, representing 17.6% of the gaming market.
conda install -c plotly plotly_expressAny kind of feedback/criticism would be greatly appreciated (algorithm design, documentation, improvement ideas, spelling mistakes, etc...).
- Created by Andrés Segura Tinoco
- Created on Mar 17, 2020
- Updated on Sep 07, 2021
This project is licensed under the terms of the MIT license.