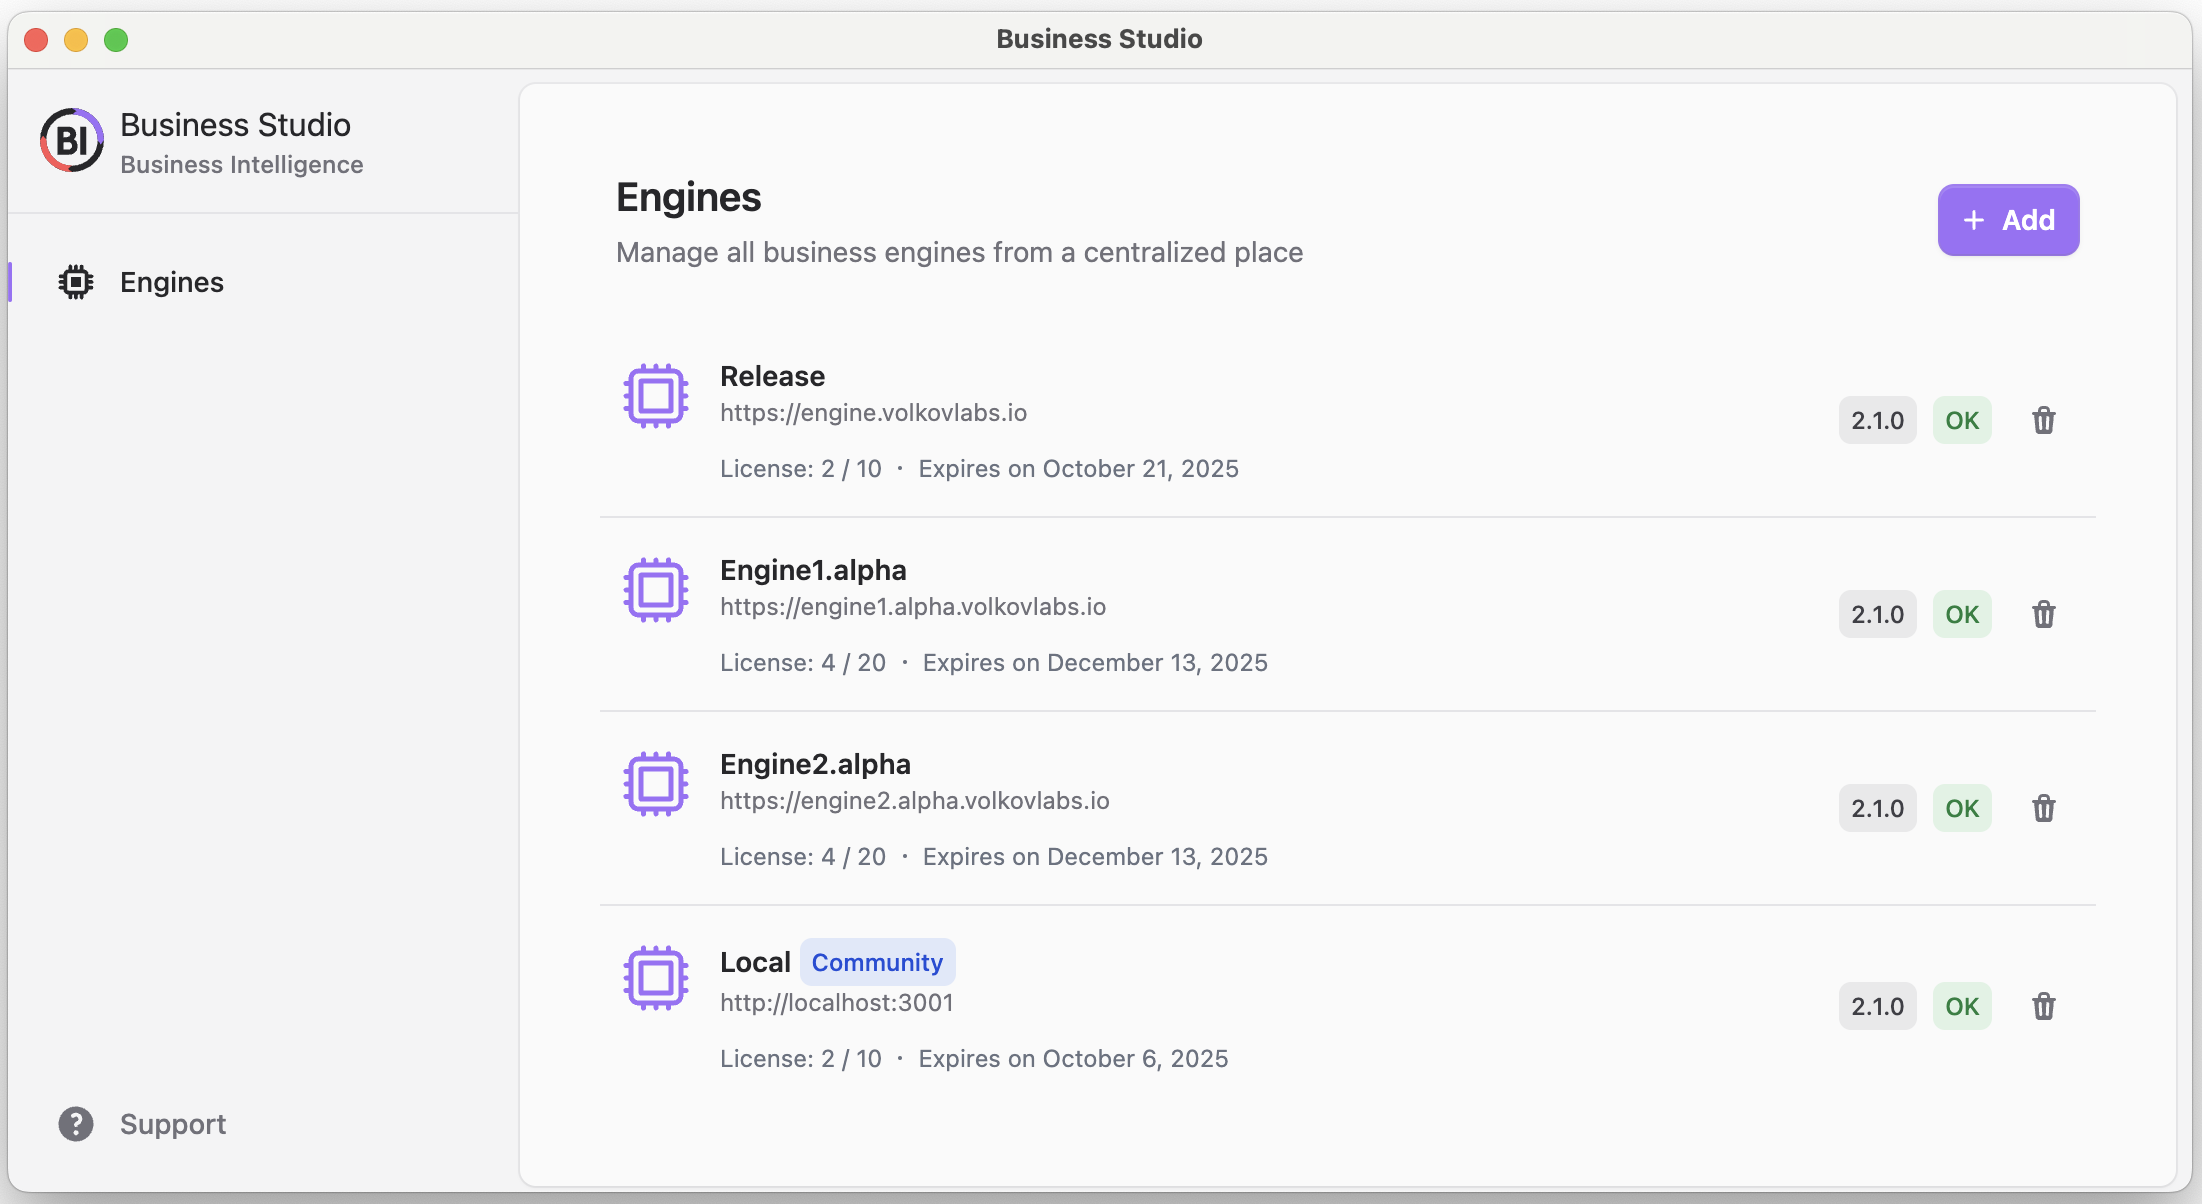
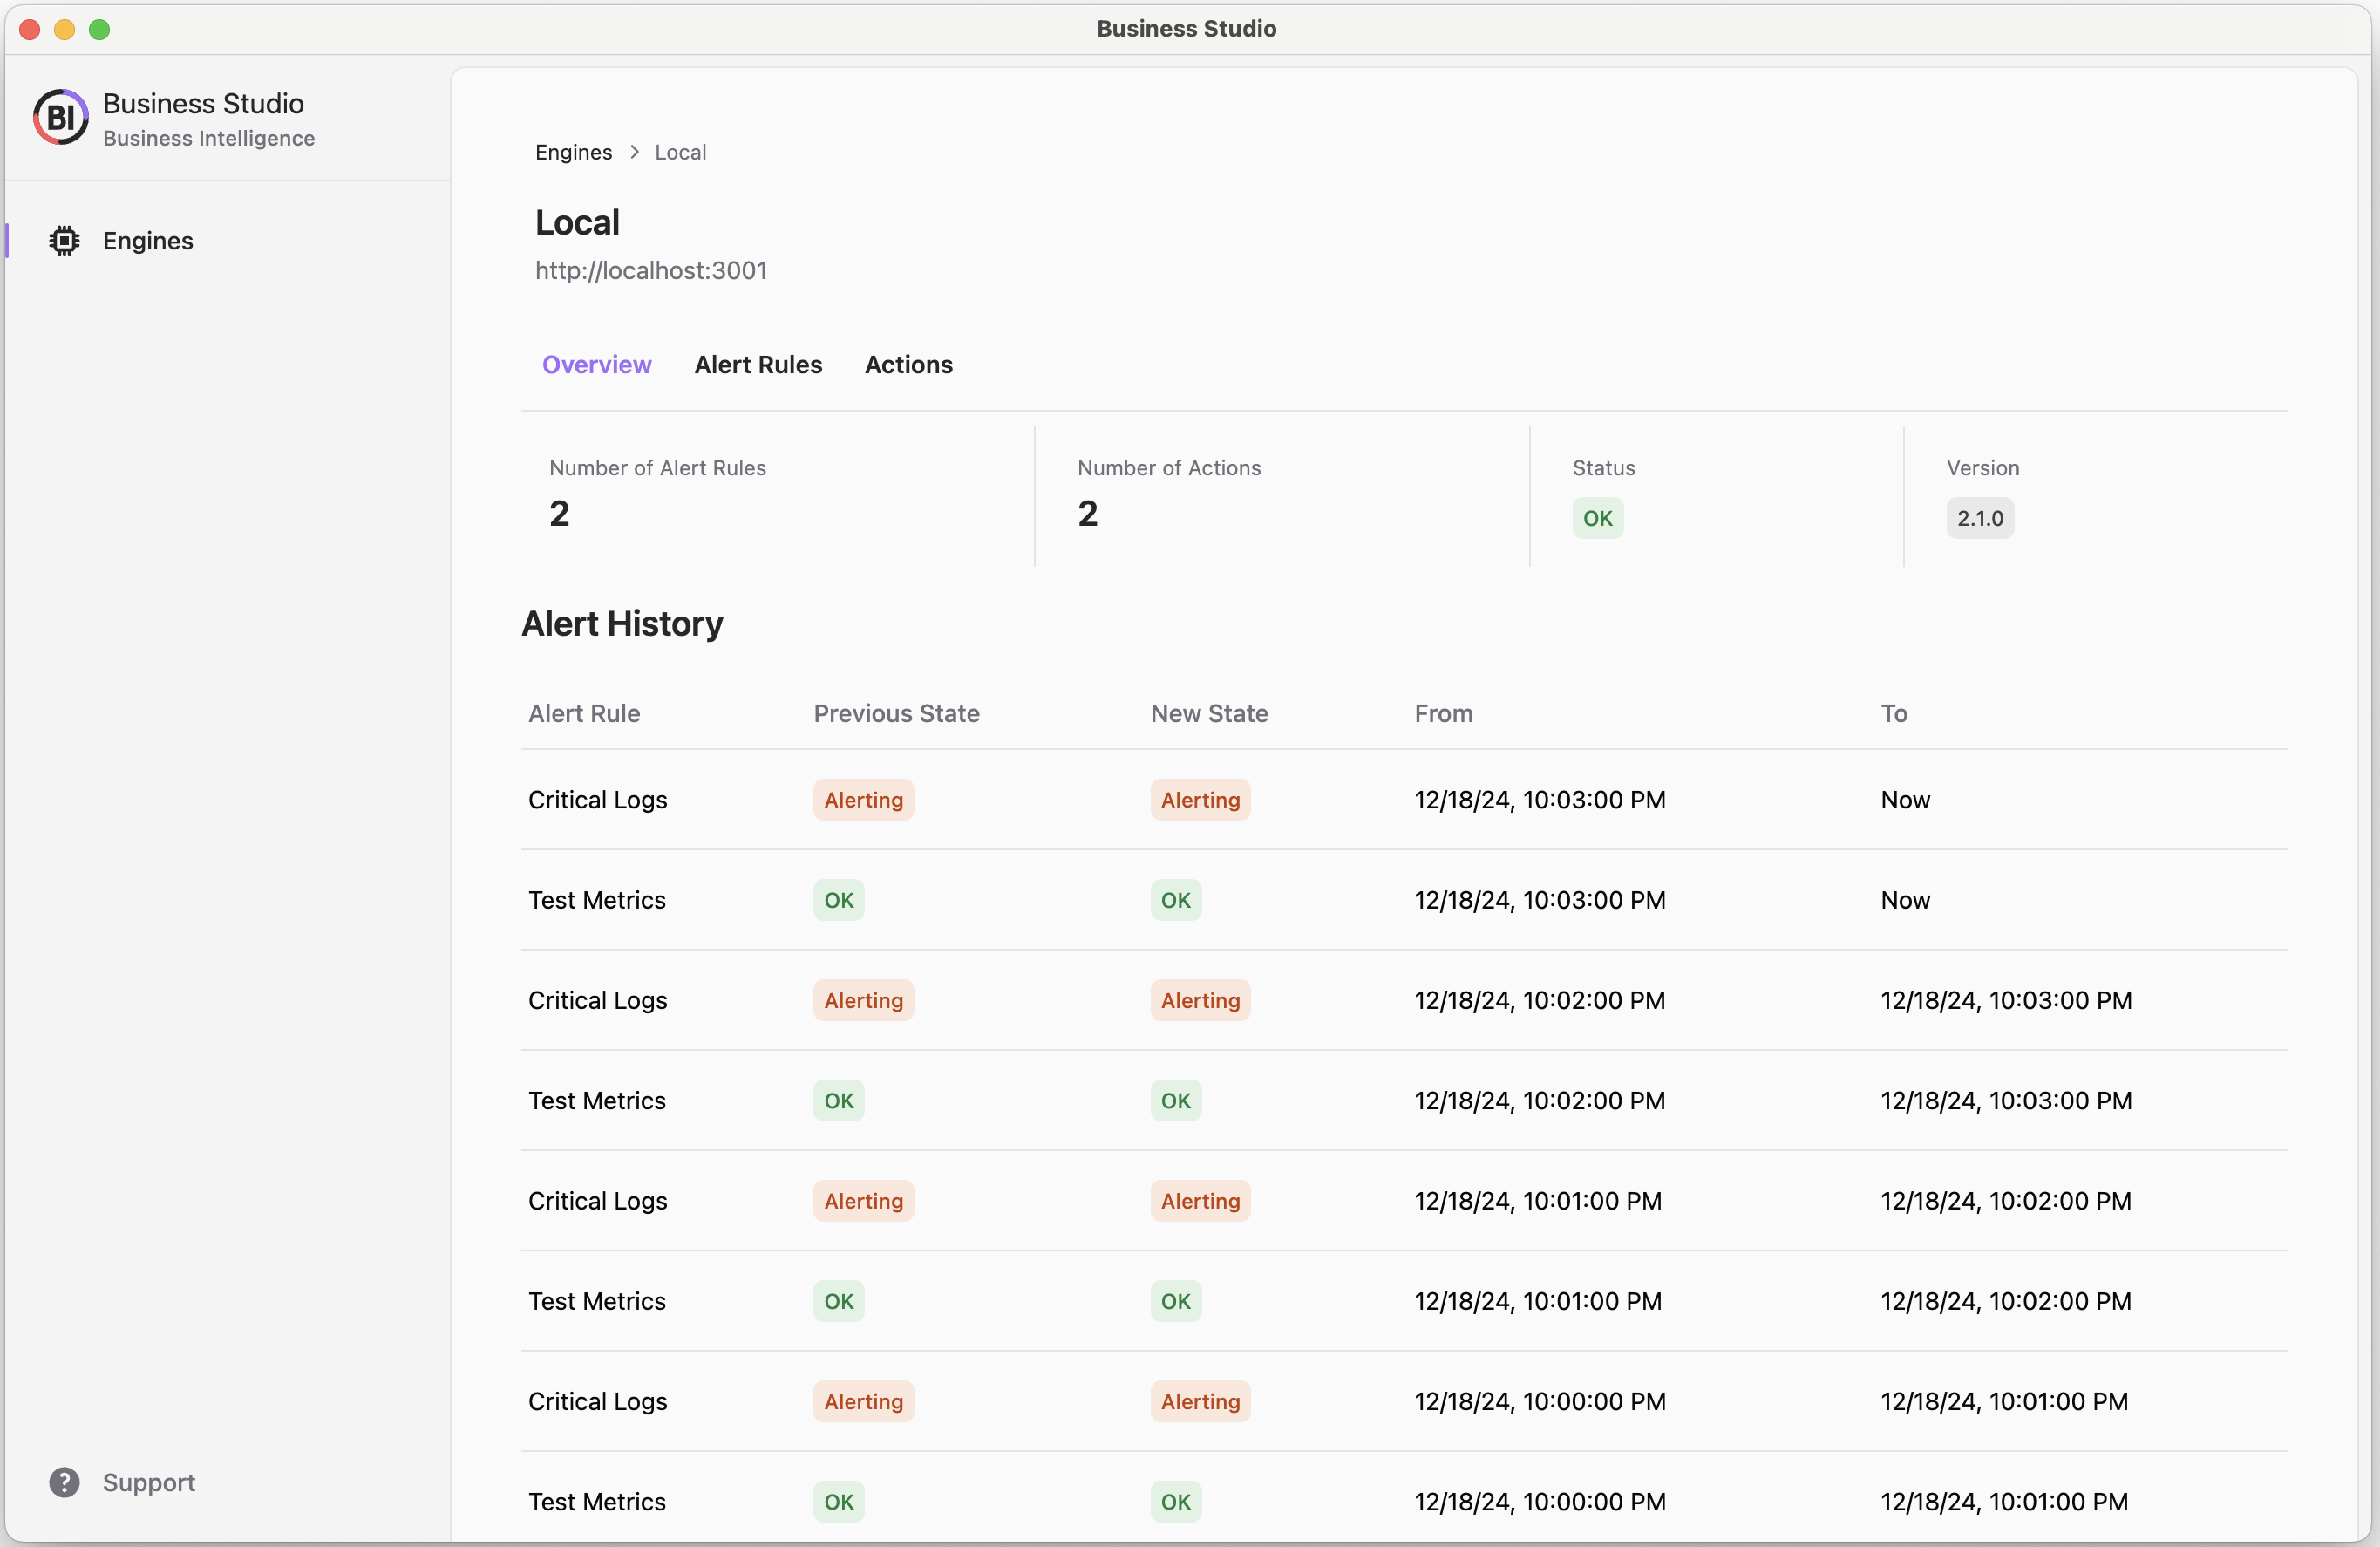
The Business Intelligence provides an accessible platform for business users:
- High performance Business Engine with distributed load and high availability to connect to Grafana instance.
- Easy to use Business Studio to manage Business Engines.
- Business Alerts based on panel queries with thresholds and variables support.
- Business Intelligence 2.X supports Grafana 11.
- Start Grafana container
docker compose --profile grafana up -d
-
Create Service Account and update
GRAFANA_TOKENin the.envfile. -
Start the Business Engine, Timescale database, and Prometheus
docker compose --profile engine up -d
- Start JSON Server to test Actions (optional)
docker compose --profile actions up -d
-
Download and start the Business Studio from Releases.
-
Configure Actions and Alert Rules:
- Use JSON server
http://json-server:3000for HTTP Request Action to create event and message files when alert triggered if started. - Use provisioned
Test Dashboardfor adding Alert Rules based on thresholds and Regex pattern.
-
Check performance and Prometheus metrics using provisioned
Business Enginedashboard. -
Stop the Business Intelligence platform
docker compose --profile engine down
docker compose --profile actions down
docker compose --profile grafana down
- Ask a question, request a new feature, and file a bug with GitHub issues.
- Subscribe to our YouTube Channel and leave your comments.


