FTL: Faster Than Light Adventure Visualiser
With this tool you can record and visualise your unique adventures in the videogame FTL: Faster Than Light. It’s a nice way to archive spectacular FTL sessions for posterity. It can also be a powerful tool for analysing and optimising your play style.

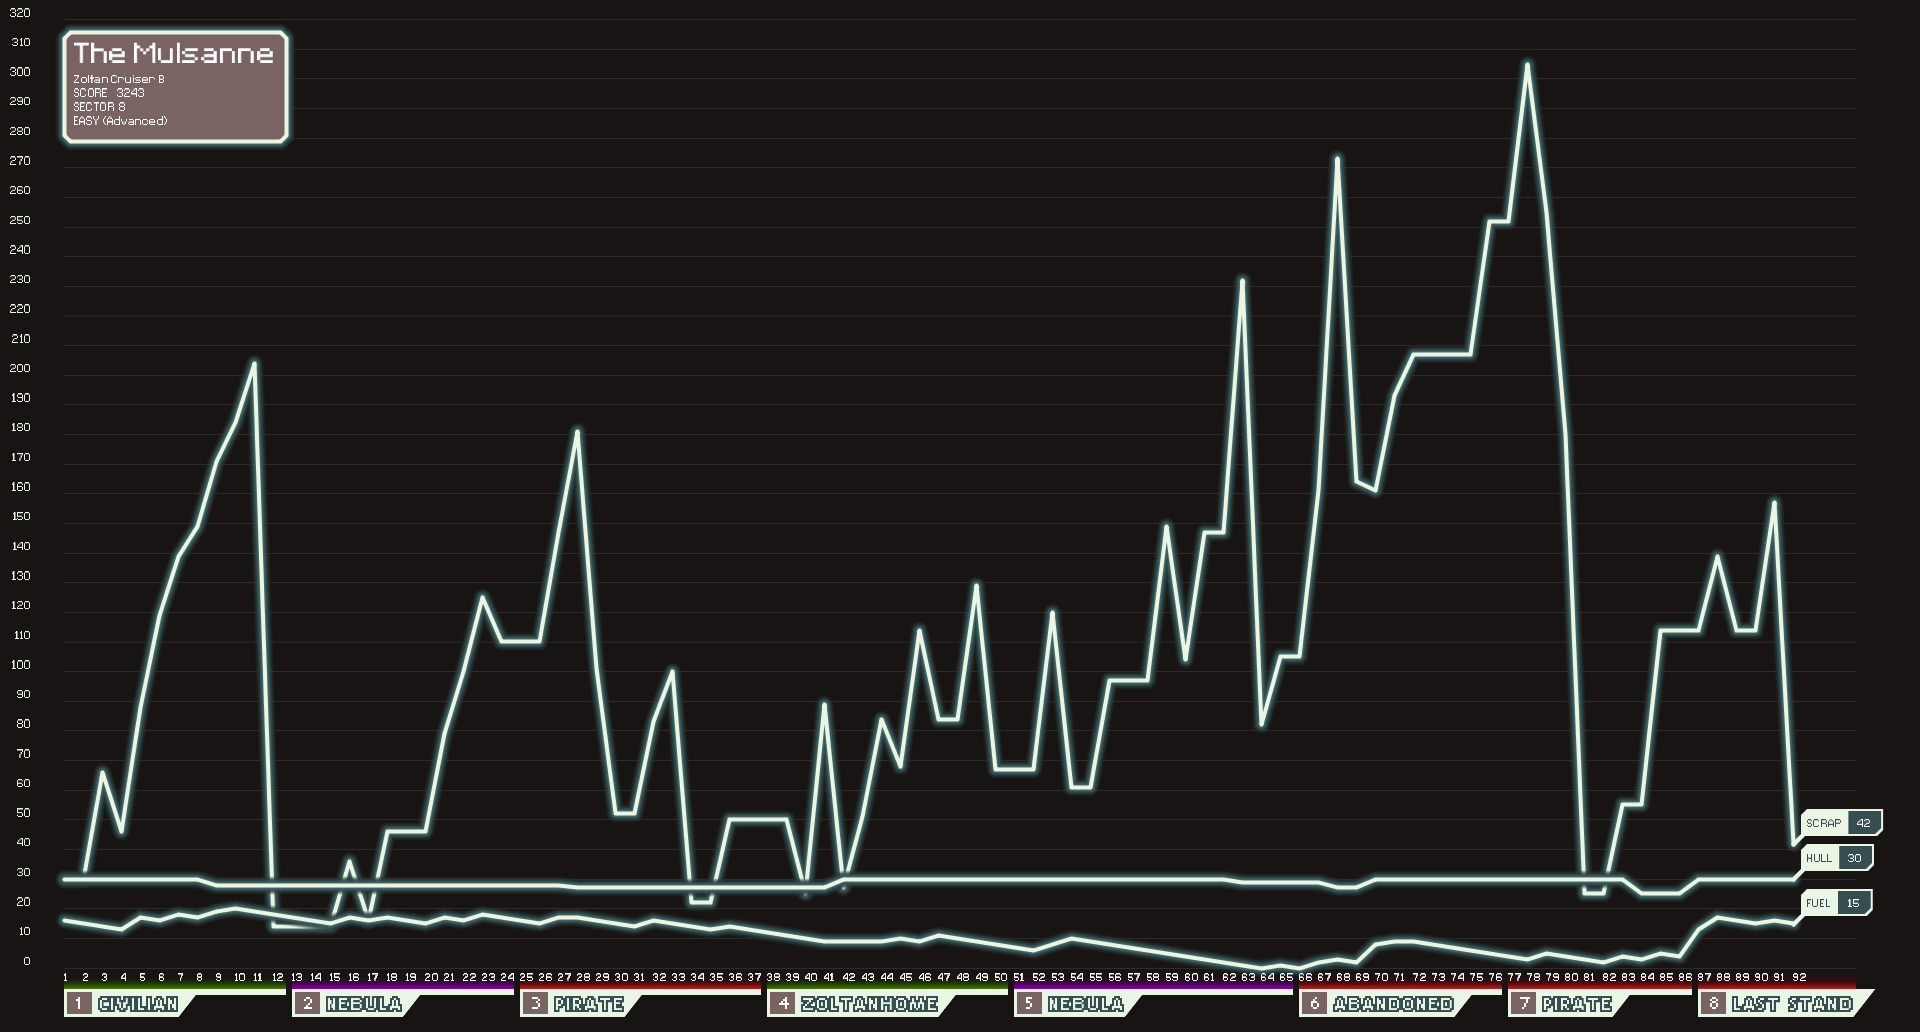
Here’s an example of a full FTL game from beginning to end:
Before you do anything make sure you have FTL: Faster Than Light installed and downloaded the latest version of FTLAV from the releases page. This application is powered by Java, meaning that it can run on any operation system (Mac OS X, Windows, Linux, etc.) that supports Java 7 or higher. It’s designed to work with any up-to-data version of FTL for Mac/Linux/Windows, no matter if you bought it from Steam, GOG, ftlgame.com or some other place. It’s possible for modded versions of FTL to work with FTLAV, but it might not work for you.
Start FTL: Faster Than Light; start a new game or continue an existing one. Now start FTLAV. If it's your first time it will ask where your FTL data is located. After this, click Open and select the file continue.sav. This file contains all information regarding your current run.
If the selected file is valid you will be presented with a second window showing an empty graph. In the main window you can select the types of data you want to display in this graph. You can toggle these on or off at any time without losing any data. Please note that when toggling changes won’t show up instantly, only when the current gamestate is updated.
Play FTL as you would normally do, with FTLAV running in the background. The graph will update automatically each time you reach a safe point in the game, usually just after an encounter or when exiting a store. It’s also possible to trigger an update by quitting FTL, but this may produce unreliable results.
If you get a game-over by either loosing or winning the game, FTL will delete continue.sav. FTLAV won’t be able to track any new data and will respond with a “File Not Found” error. This is perfectly normal. You can still save your graph as an image by pressing the Export image button. This will save the graph as two PNG images, one with a transparant background and one without, at the current resolution of the graph window. Additionally it’s possible to export a detailed table with information on each possible data point for each visited beacon. This is done by clicking the Export data button. This will save all data as a CSV-file. This can be read by pretty much any spreadsheet application. This can be used to for example maintain an Excel document containing data from all runs with a particular type of ship. With CSV being such a flexible format you might have very different ideas on what to do with your FTL data. If so, share your creations with the community, and please don’t forget to mention FTLAV. If you’re using Apple Numbers you might want to convert the file using this script so Numbers can parse it correctly.
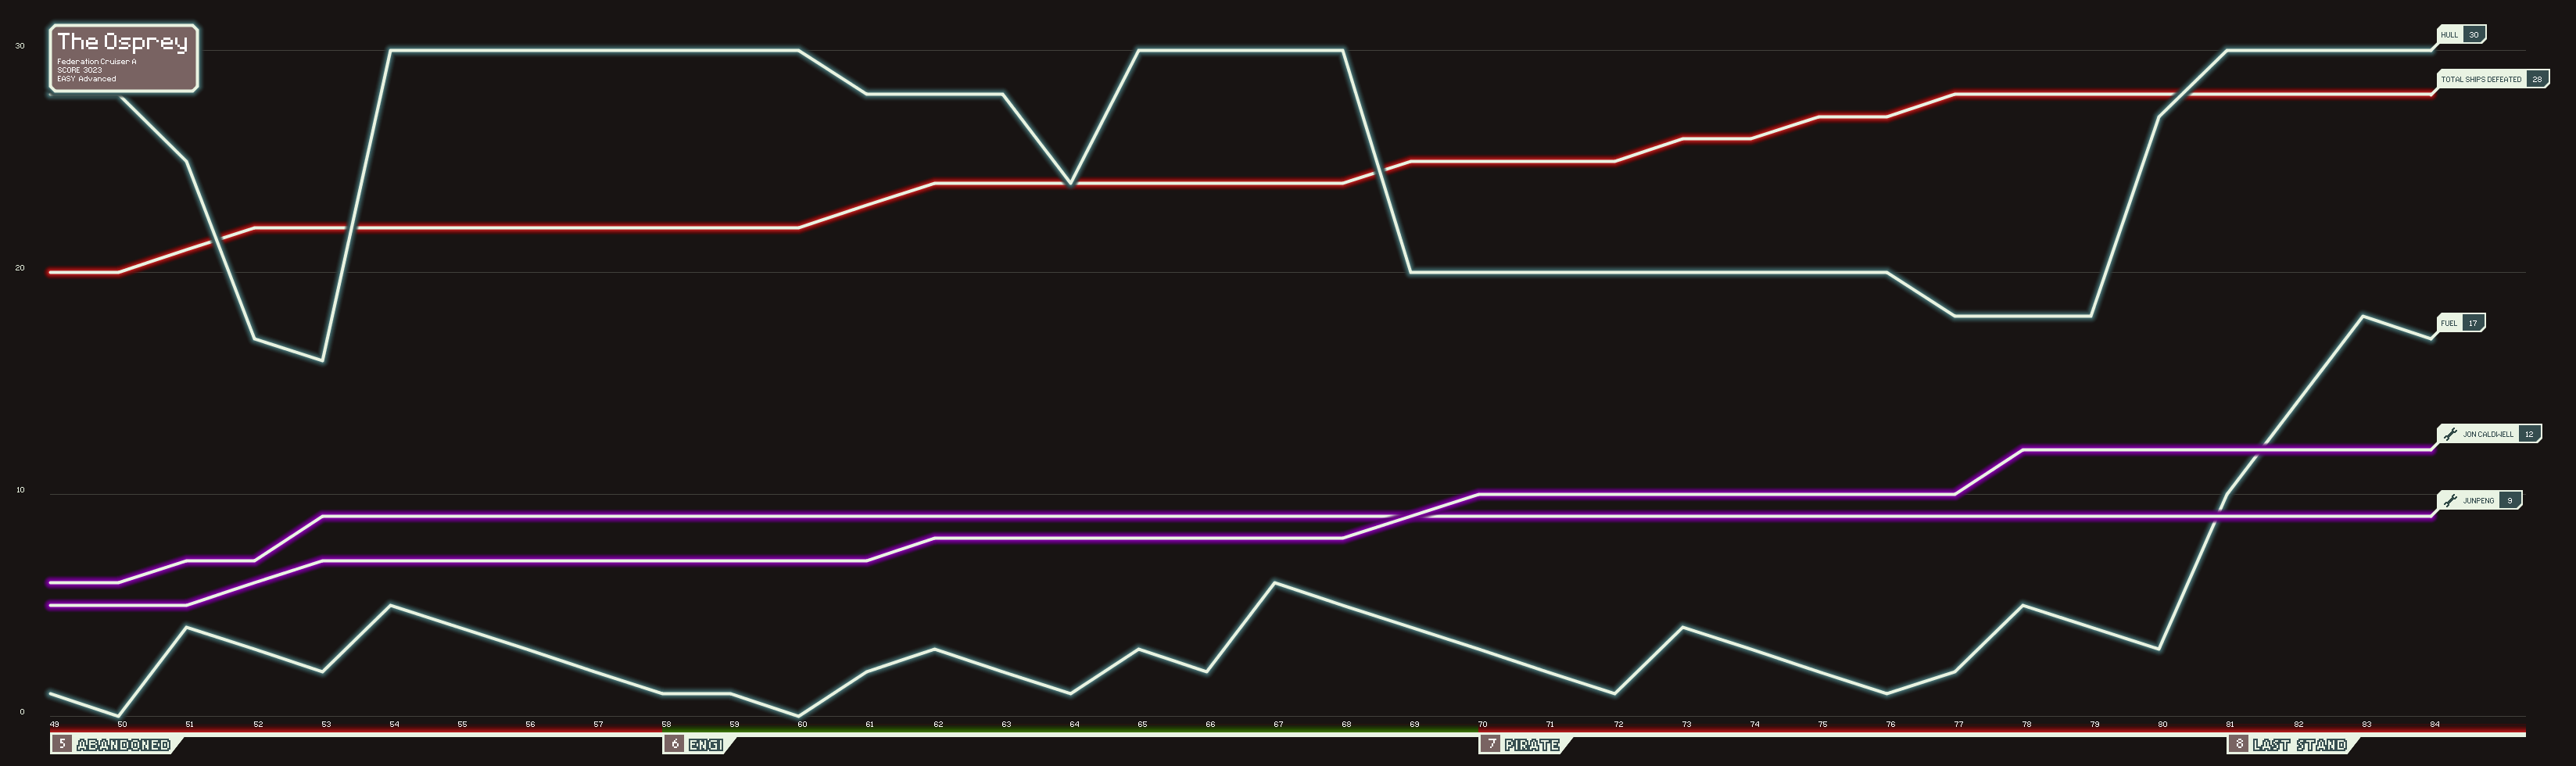
Here’s an example of a CSV-file generated by FTLAV. The image below was captured during the same session.
It’s possible to track data from games that are already ongoing. It’s however not possible to look into the past from the moment you’ve started tracking. This also means that if you quit FTLAV, all data from before the current beacon will be lost. You can however open and close FTL at any moment without using any graph data.
- The method for storing the game state history has been completely redone. Instead of storing the complete history in RAM, each new game state is written directly to a CSV file. This change makes FTLAV a much more flexible and powerful tool. This means you can stop and resume tracking FTL data at any time. This also opens up the possibility for creating your own visualisations on top of FTLAV.
- The graph renderer code has been completely rewritten. This not only improves overal performance, but also makes it easier to write alternative visualisations.
- The graph renderer is now available as a stand-alone Processing sketch.
- More compact UI.
- Added graph legend.
- New and improved graph types!
- Improved per-beacon line graph. Graph lines now can show ∆ between beacons instead of absoluut values.
- New per sector bar graph, showing totals and averages per sector.
- New timed scatter plot, showing changes on two axis over time.
- New systems upgrade diagram.
- Graph scales in such a way that it never becomes to dense to display on a single screen.
- Mouseover tooltips for more in-depth information about a particular beacon or point in the graph.
- New data types
- Enemy fleet advancement
- Info on any system (capacity, current energy, damage) on the players ship and nearby ships (CSV exports only)
- Export the full dataset as a CSV-file
- New data types
- Scrap count
- Hull level
- Fuel count
- Drone Parts count
- Missiles count
- Crew size
- Ship Oxygen level
- Crew member health
- Crew skills (pilot, engine, shields, weapons, repairing, combat)
- Crew stats (total repairs, combat kills, evasions, survived jumps, skills points)
- Ship log (total ships defeated, total beacons explored, total scrap collected, total crew hired)
- Graph features
- Labeled sectors (name, type, number)
- Beacon labels (as N explored beacons)
- Labeled graph lines
- Coloured graph lines (purple for crew, blue for the rest)
- Graph title (ship name, current score, difficulty, Advanced Edition on/off)
- FTL style colour scheme
- FTL style blue glowing lines
- FTL style typography
- Export to PNG
- Export to PNG with transparant background
- Help menu
If you have ideas, suggestions, problems or encountered a bug, please let me know, preferably by filing an issue at this GitHub repository.
If you want to delve into the code you will probably need some knowledge of Processing (Java library responsible for the rendering of the graph) or/and Java (UI, data-parsing and basically everything else). For the Java part you can look at Vhati’s version of FTL Profile Editor, of which a large part of the code of this project is based. Use Maven to compile the source code.