Flaky coverage report - wrongly reported uncovered lines when PL/SQL profiler reports 0 for total_time #1125
Comments
|
function proftab_results(a_object_owner varchar2, a_object_name varchar2, a_coverage_id integer) return t_proftab_rows is end; updated the function - dbmspcc runs don't match profiler_runs - trying to catch up by timestamp and unit_name |
|
@al-hexagon please not that the current develop branch looks quite different. Maybe you can use it. What would help us is a test case that shows what's wrong. Thanks. |
|
@PhilippSalvisberg - which development do you mean? the code in utPLSQL/source/core/coverage/ut_coverage_helper_profiler.pkb am i missing an entire branch? Anyhow - i'll try to create a sample. |
https://github.com/utPLSQL/utPLSQL/tree/develop/source - it includes a log of changes since the release of 3.1.10.
Perfect. Thanks. |
|
try this one: drop table demo_cc_issue; create or replace PACKAGE DEMO_CC_ISSUE AS /* TODO enter package declarations (types, exceptions, methods etc) here */ function demo_issue(p_in varchar2) END DEMO_CC_ISSUE; procedure setup_data AS END setup_data; function demo_issue (p_in varchar2) END demo_issue; END DEMO_CC_ISSUE; /* generated by utPLSQL for SQL Developer on 2021-03-05 12:24:33 */ --%suite(ut_demo_cc_issue) --%test END ut_demo_cc_issue; /* generated by utPLSQL for SQL Developer on 2021-03-05 12:24:33 */ -- END ut_demo_cc_issue; exec demo_cc_issue.setup_data; it shouldn't make a difference if you check these lines one by one: but it does. plsql_profiler always sees the line 23 - but never 24 and 25. If it runs many times - the "total_time" is getting > 0 and the line is hit - but thats a random output. in the meantime - i'll give the development branch a try |
|
function proftab_results(a_object ut_coverage_helper.t_tmp_table_object, a_coverage_run_id raw) return t_proftab_rows is end; this should fit into the development branch, too. |
SetupOracle Database 19c (19.10). I amended you test case a little. I installed this in my test environment: declare
e_tab_not_found exception;
pragma exception_init ( e_tab_not_found, -942 );
begin
execute immediate 'drop table cc_issue';
exception
when e_tab_not_found then
null;
end;
/
create table cc_issue (
key_col number,
key_value varchar2(200 char)
);
begin
for x in 48..122 loop
insert into cc_issue values (
x,
chr(x)
);
end loop;
commit;
end;
/
create or replace package demo_cc_issue as
function demo_issue (
p_in varchar2
) return number;
end demo_cc_issue;
/
create or replace package body demo_cc_issue as
function demo_issue (
p_in varchar2
) return number as
l_value number;
begin
select count(*)
into l_value
from cc_issue
where lower(key_value) like p_in;
if (
l_value = 0 -- this line is hit in any case
or l_value = 1 -- this line is hit only when: value != 0
or l_value = 2 -- this line is hit when: value not in (0, 1)
)
then
dbms_output.put_line(l_value);
else
dbms_output.put_line('whatever');
end if;
return l_value;
end demo_issue;
end demo_cc_issue;
/
create or replace package ut_demo_cc_issue is
--%suite(ut_demo_cc_issue)
--%suitepath(alltests)
--%test
procedure demo_issue_1;
--%test
procedure demo_issue_2;
--%test
procedure demo_issue_3;
end ut_demo_cc_issue;
/
create or replace package body ut_demo_cc_issue is
procedure demo_issue_1 is
l_actual integer;
begin
-- covers everything except line 20 (OK)
l_actual := demo_cc_issue.demo_issue('a');
ut.expect(l_actual).to_equal(2);
end demo_issue_1;
procedure demo_issue_2 is
l_actual integer;
begin
-- covers everything except line 15 and 20 (OK)
l_actual := demo_cc_issue.demo_issue('1');
ut.expect(l_actual).to_equal(1);
end demo_issue_2;
procedure demo_issue_3 is
l_actual integer;
begin
-- covers everything except line 14, 15 and 20 (OK)
l_actual := demo_cc_issue.demo_issue('xx');
ut.expect(l_actual).to_equal(0);
end demo_issue_3;
end ut_demo_cc_issue;
/demo_issue_1When I run code coverage for
IMO the result is correct. Line 20 is not hit in this case demo_issue_2When I run code coverage for
IMO the result is correct. Line 15 and 20 are not hit in this case. demo_issue_3When I run code coverage for
IMO the result is correct. Line 14, 15 and 20 are not hit in this case. ConclusionI do not see a flaw in the calculation of code coverage. The results are consistent. It does not matter how often I run them. Passing different values to demo_cc_issue.demo_issue('a');
demo_cc_issue.demo_issue('1');
demo_cc_issue.demo_issue('xx');should produce the same code coverage result is wrong. |


|
That's interessting - because this is what i get if i run the entire "suite" with all 3 tests.
As you can see - there are missing lines and the dbms_output.put_line proofs my outputs (case 1:2 case 2:1 case 3:0 ) to be wrong. That's confusing. You're DB Version is 19.10 (latest patchset) i guess? |

|
if i run case1 separate :
This is quite different to your output - it looks like the entire if statement wasn't covered - but the output is still 2 - so it must be covered. |

|
row 20 shoudn't be covered in any case - correct. But running the enitre suite should cover all lines in the IF statement.
wasn't ment seperate - if you execute all lines in a single test - the output should always be the same. All lines covered without the else block.
|

|
If I run the complete suite then the code coverage looks like this:
This looks good. And yes I ran it against 19c (19.10). I also created an additional test case based on your comments above. It does not make sense but it runs technically the code of the other three test cases. procedure demo_issue_4 is
l_actual integer;
begin
l_actual := demo_cc_issue.demo_issue('a');
l_actual := demo_cc_issue.demo_issue('1');
l_actual := demo_cc_issue.demo_issue('xx');
ut.expect(l_actual).to_equal(0);
end demo_issue_4;And it produces the same code coverage output. That's expected. Looks good. I'm sorry I cannot reproduce the issues you have. I have to suspect that you are running on a different Oracle Database version and/or different utPLSQL version and/or running different tests. We need a reproducible test case to analyze this further. And it would help if you could provide also the information we ask when opening a bug report (see https://github.com/utPLSQL/utPLSQL/issues/new?assignees=&labels=&template=bug_report.md&title=). |

|
Yes - it doesn't make sense to run it in this way - but i'm running a solution with >100.000 lines of code and this will not cover each "if" in a single unit test. It's just a demo why i see different results if i run a "suite" compared to the outputs / expectations of coverage. Its like the situation with my devs: I'll check the link for Bug reporting. |
Well, if you could provide a test case where the dbms_output is produced, but code coverage says this dbms_output.put_line statement was not executed. That would clearly indicate a bug. Either by the Oracle Database or utPLSQL. |
this one^^ See the output on SQLDeveloper 2 1 0 - but cc tool doesn't cover line 14. Which couldn't happen as dbms_output prints 1 |
|
isolated demo_issue_2:
see the output on the left. SQL Developer prints 1 |

|
So you are using utPLSQL v3.1.11.3469-develop and Oracle Database 19.7. As mentioned before, I cannot reproduce this issue with utPLSQL v3.1.11.3469-develop and Oracle Database 19.10. Can apply the latest RU and try again? We still do not have a reproducible test case. |
|
i'm not sure if i get you right. You're asking me to update to 19.10 and run it again? |
Yes. We both run the same code. We both run the same utPLSQL version. The difference is the Oracle Database version and the platform. It's working as expected on my side. But it produces different results on your side. So I assume that the reason for this different behavior is the Oracle Database. Of course I might be wrong. At least we can rule that out afterwards. If you have a better idea, then please let me know. |
|
I think it cpuld be a flaw in dbms_profiler related to formatting. The output could be confusing in example you're providing as the report doesn't show first condition in if statement as neither covered or not covered. |
|
@jgebal dbms_profiler is based on lines and therefore formatting of the code is important. However, @al-hexagon and I run the same code, formatted in the same way, but coverage produces different results. That's strange. That formatting has an effect on line coverage is expected, but combined with code block coverage this should not matter. |
|
yes and no - coverage shouldn't rely on code formatting. But as said on beginning - If we just rely on plsql_profiler outputs in plsql_profiler_data where total_occur > 0 then - the entrie block withtin the IF statement isn't covered at all. Which would mean - the ut3 reporting is wrong if it takes lines in which are total_occure = 0 but have total_time > 0.
Thats why i said on the beginning - the UT3 should use the blocks output, too. |
|
@al-hexagon: When installing the script provided here and running the complete test suite than only line 20 is reported as "not covered". That's correct. Can we agree on that?
utPLSQL uses line coverage and code block coverage. The latter only if Oracle Database 12.2 or later is used. The result is combined. Code coverage is visible only if one line contains more than one code block and not all blocks in that line are covered.
Well this is a thesis to be proven. I know about some flaws, but they are irrelevant in this case. |
|
can you point me to the code line where the blocks are used? I don't find that. |
|
@al-hexagon I ran the tests against an Oracle Database 19.7. Same result. So I guess upgrading to 19.10 will not solve your issue. There is something else which is causing a different result. I recompiled the code with different I ran the tests also in multi-tenant and non-multi-tenant environments. Same result. After running the test suite I ran also the following query as select d.line#,
d.total_occur
from plsql_profiler_runs r
join plsql_profiler_units u
on u.runid = r.runid
join plsql_profiler_data d
on d.runid = r.runid
and d.unit_number = u.unit_number
where r.runid = (
select max(runid)
from plsql_profiler_runs
)
and u.unit_name = 'DEMO_CC_ISSUE'
and u.unit_type = 'PACKAGE BODY'
order by d.line#;The result was: I agree that the raw data provided by the PL/SQL profiler looks wrong.
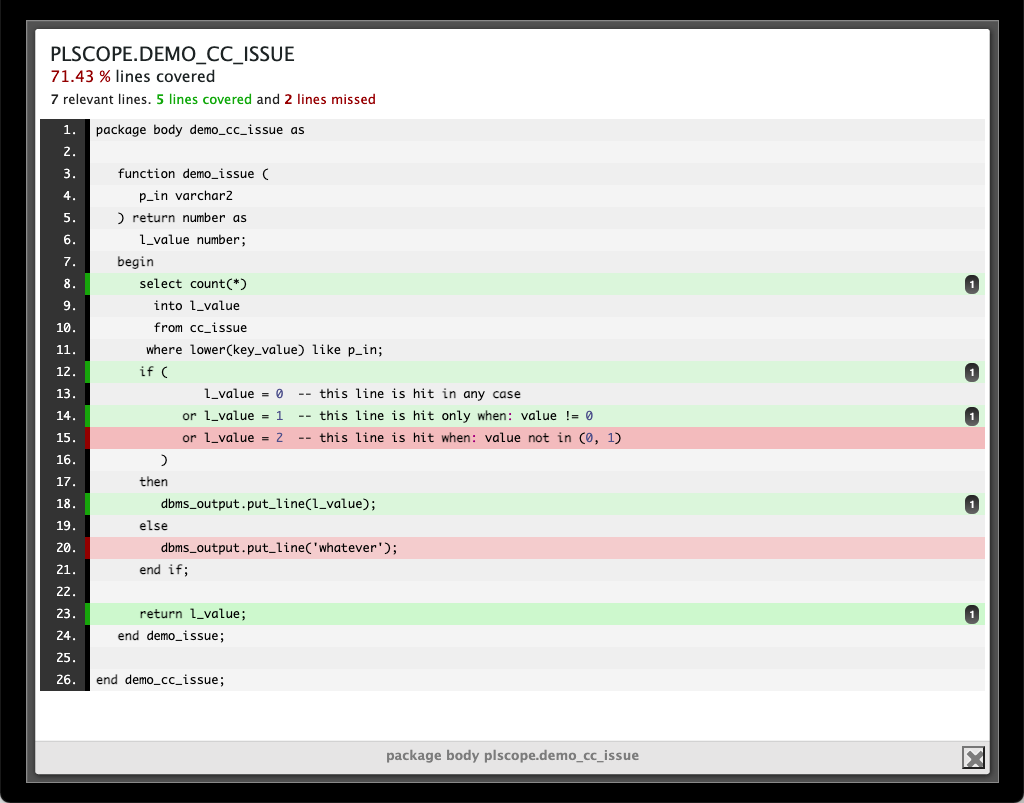
However, from a utPLSQL perspective the output of the code coverage report is relevant. And the report looks like this:
While you can argue that not all relevant lines are marked as "green", all uncovered lines are correctly marked as "red". However, thanks to the effort of @jgebal and @lwasylow the provided raw data has been enhanced to produce a reasonable code coverage report. I cannot produce a wrong HTML code coverage report based on this test case. |

|
|
The point why you see the green lines 14&15 is, because the reporter cares about total_occur > 0 and makes use of total_time > 0 in case total_occus is zero. But total_time > 0 isn't stable in my results. with repsect to dbmspcc - i see the same if i scan the code for dbmspcc_blocks. |
Ah I see. The workaround of using
You're wrong. Code block coverage is implemented. Just not the way you expected it. See also #1125 . I also explained it in my utPLSQL talk.
I am not sure what the result of the code block coverage is when select b.block,
b.line,
b.col,
b.covered
from dbmspcc_runs r
join dbmspcc_units u
on u.run_id = r.run_id
join dbmspcc_blocks b
on u.run_id = b.run_id
and u.object_id = b.object_id
where r.run_id = (
select max(run_id)
from dbmspcc_runs
)
and u.name = 'DEMO_CC_ISSUE'
and u.type = 'PACKAGE BODY'
order by b.block;It should be possible produce a coverage report based on block coverage only. However, I don't know what the impact is, because there were a bunch of wrong results in 12.2. That was one reason to make line coverage "leading". Another one was to keep the functionality in the Oracle Database 11.2 and 12.1 as well. I think I understood the problem now. Code coverage is "flaky" in certain environments. Thanks @al-hexagon for reporting the issue and for bearing with me. |
|
here is the prroof of concept about failing reporting - you just have to run often enough:
outputs: This is the same for line 14 - not always the same run - not always the same line - but always the same issue. Fluctuation in PLSQL Profiler outputs. |

|
I know it's used in reporting to show blocks - but blocks are only coming into picture as long as the line is covered. If this "hidden" because of the "bug" - you'll not see blocks. But - adding the blocks per line into the decision to be "covered" or "not covered" will make it much more reliable - even if the profiler says "0 0 0 0" |
|
The entirety of problem is not related to utPLSQL but to Oracle PLSQL_PROFILER. We rely on total_time, when plsql_profiler shows wrongly We could fall back to use only The problem is that actually we cannot use block coverage as a leading source of coverage. If we do this, all lines, including comments and other non-executable lines would be marked as executed or not-executed. This is because block coverage slices code into code-blocks and it really doesn't care what is inside that block. @lwasylow and I had a conversation in Liverpool with Bryn Llewellyn who was at the time working in Oracle and who (as far as I understand) was author or co-author of concept for block-coverage in PL/SQL. I have thought of using pure plsql block coverage without dbms_profiler. It would only be viable if we would have some reliable source of information about which lines of code are executable or not executable. The only thing I can thing of at the moment is PL/SCOPE. I did not dive deep into PL/SCOPE to see if it would be feasible and reliable source of information needed and would accessing this data for creating line- overage be performant. Also, such change would be a major effort. |
PL/Scope will not help you to identify executable lines. It's limited to SQL statements and identifiers. PL/SQL statements are missing. No way to get a complete set of executable lines from that. It's a dead end. At least for database versions up to 21c. IMO you need a parser to get the executable lines. We at Trivadis have such a parser. And for SonarQube we identify the executable lines which are used in SonarQube when no code coverage reports are available. However, all 3rd party parsers are unreliable in some situation (even the parsers used in SQLDev and SQLcl). In other words they do not understand 100% of PL/SQL code. This will lead to other wrong results regarding "executable lines". There are options to incorporate such a parser in utPLSQL, but it will be a lot of work or it will increase the complexity of the architecture significantly. And right know I doubt that it is worth the effort. I see another approach. Using the PL/SQL profiler only to identify executable lines (as today) and use code block coverage to report covered lines and blocks. The only difference to the current approach is that the covered lines reported by the PL/SQL profiler is ignored. Always. - It's just an idea nothing more. I'm sure there are some special cases to cover. |
As descirbed by oracle - the code coverage should only point on "total_occur". But this is - honestly - not true.
UtPlSqlv3 is pointing to total_occur and total_time is plsql_profiler_data - which is fine, but leads to wrong outputs im some cases.
e.g.
...
What we get:
line 3 & 4 are not "covered" because of limitation in plsql_profiler and engine swapping
This means - in raw data you'll see in plslq_profiler_data the following
line 3: 0 0 0 0 (total_occur, total_time, min_time_max_time)
line 4: 0 0 0 0
....
everything is 0 - looks like - the code was never hit. But that's not true - the code was hit - we all know it must be hit.
If i run the same code 100 times - i have ~50% a "hit" - sometimes the reports show total_time > 0 and total_occur always = 0.
So - the reporter marks row 3 & 4 sometimes yellow, sometimes red.
I took a peak into the code and checked the rows in dbmspcc_blocks, too.
And here you'll have at least one hit - one block is hit.
I suggest to check this table, too.
I modified the package: UT_COVERAGE_HELPER_PROFILER (line 56-->)
at:
function proftab_results(a_object_owner varchar2, a_object_name varchar2, a_coverage_id integer) return t_proftab_rows is
l_coverage_rows t_proftab_rows;
begin
select
d.line#,
case when sum(d.total_occur) = 0 and (sum(d.total_time) >0 or sum(bb.covered) > 0) then 1
else sum(d.total_occur)
end total_occur
bulk collect into l_coverage_rows
from plsql_profiler_units u
join plsql_profiler_data d
on u.runid = d.runid
and u.unit_number = d.unit_number
left join dbmspcc_units bu
on bu.name = u.unit_name and bu.run_id = u.runid
left join dbmspcc_blocks bb
on bu.run_id = bb.run_id and d.line# = bb.line and bb.covered = 1 and bu.object_id = bb.object_id
where u.runid = a_coverage_id
and u.unit_owner = a_object_owner
and u.unit_name = a_object_name
and u.unit_type in ('PACKAGE BODY', 'TYPE BODY', 'PROCEDURE', 'FUNCTION', 'TRIGGER')
group by d.line#;
end;
Please verify my assumtion - but this seems to take care about these kind of "hits", too.
The text was updated successfully, but these errors were encountered: