Replies: 2 comments 1 reply
-
|
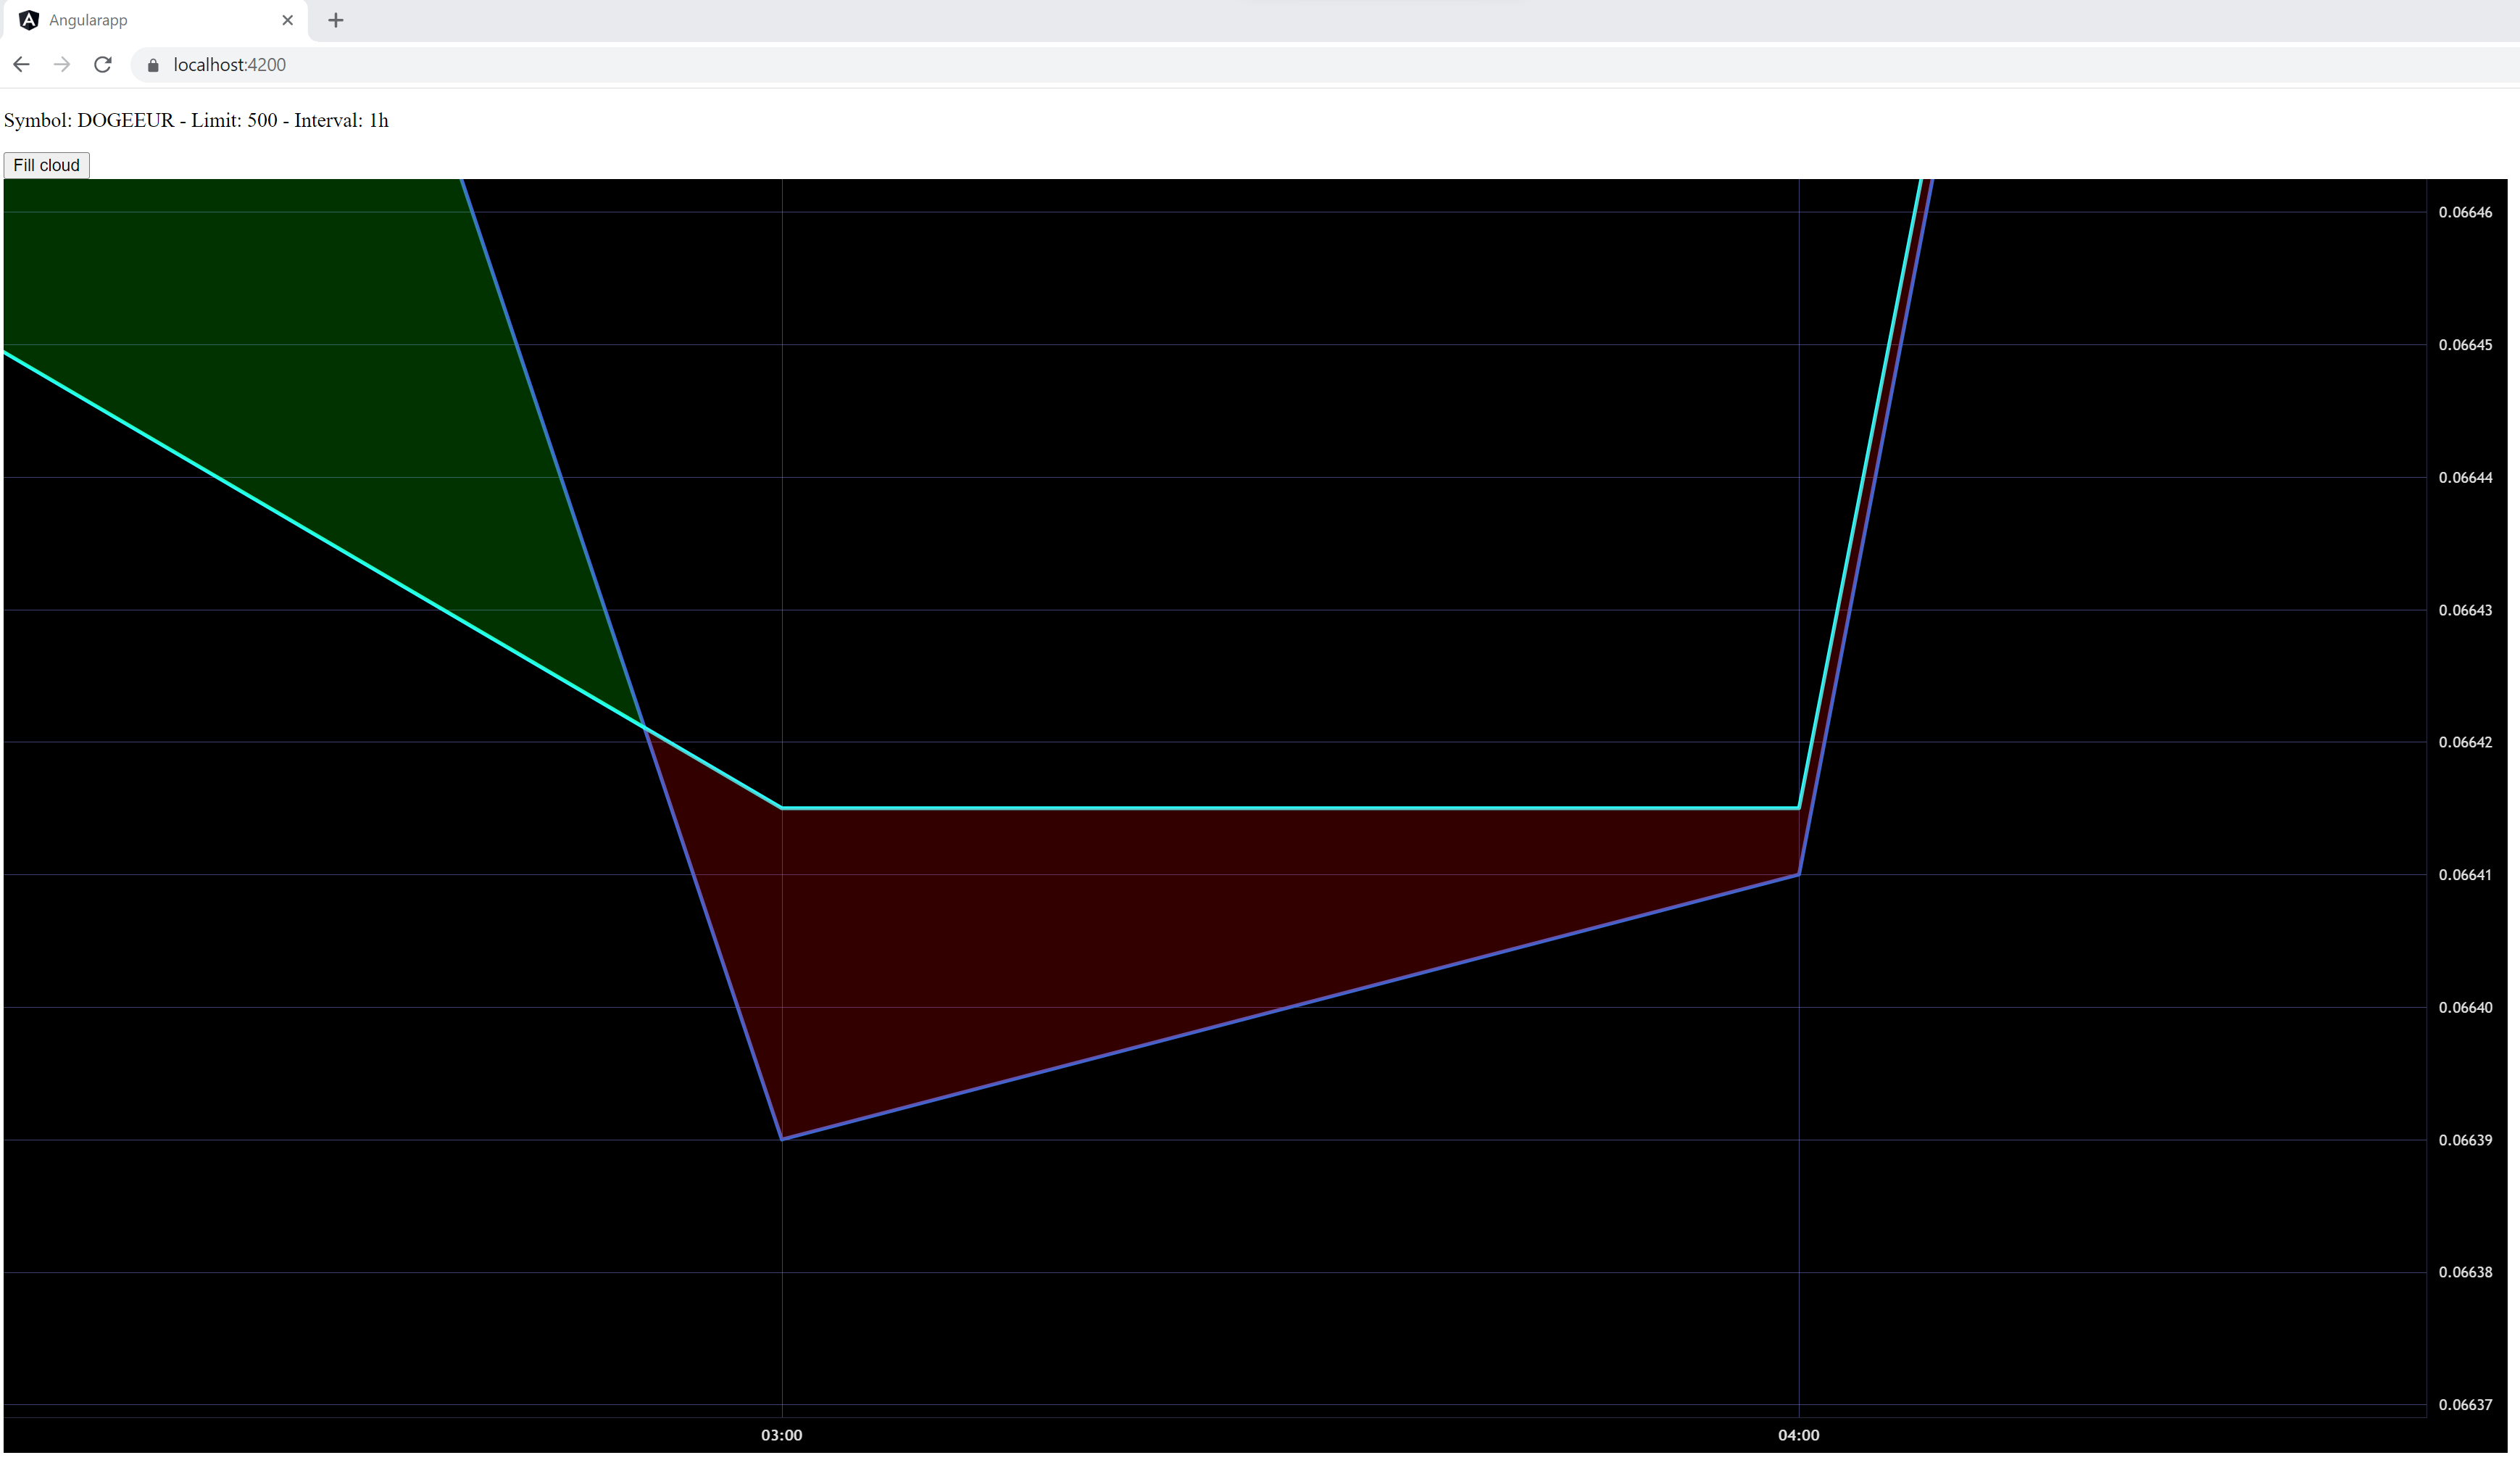
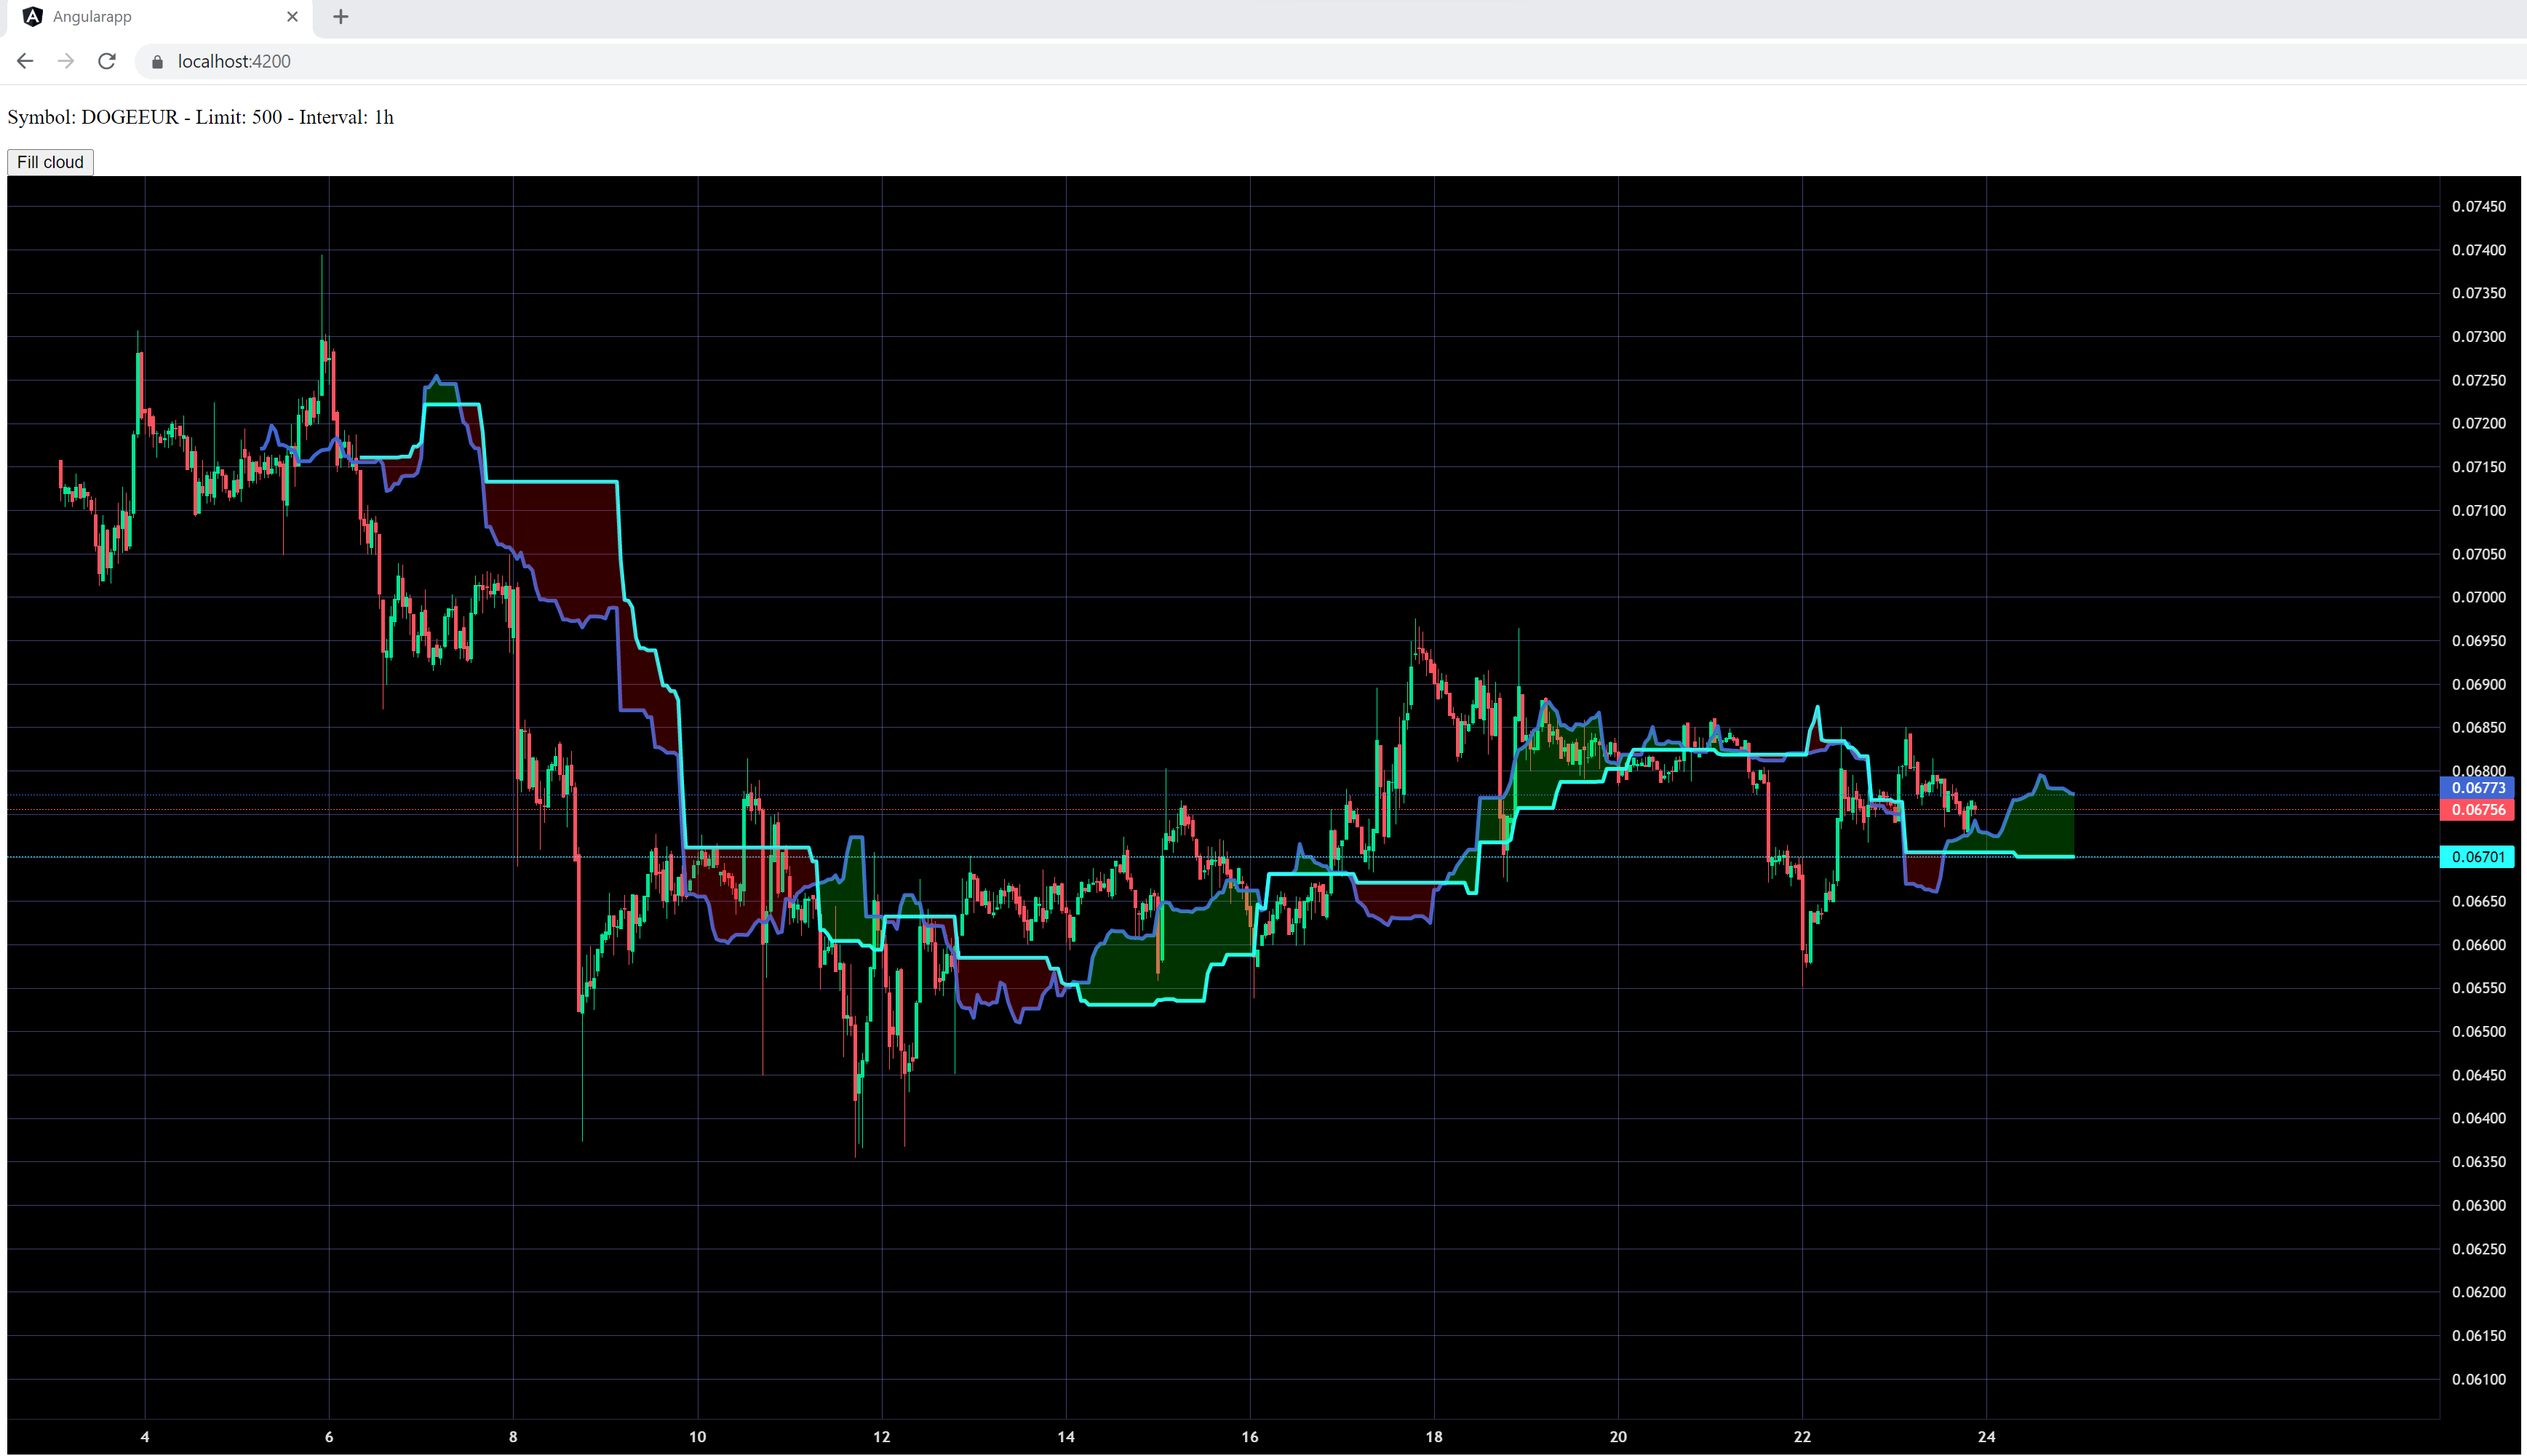
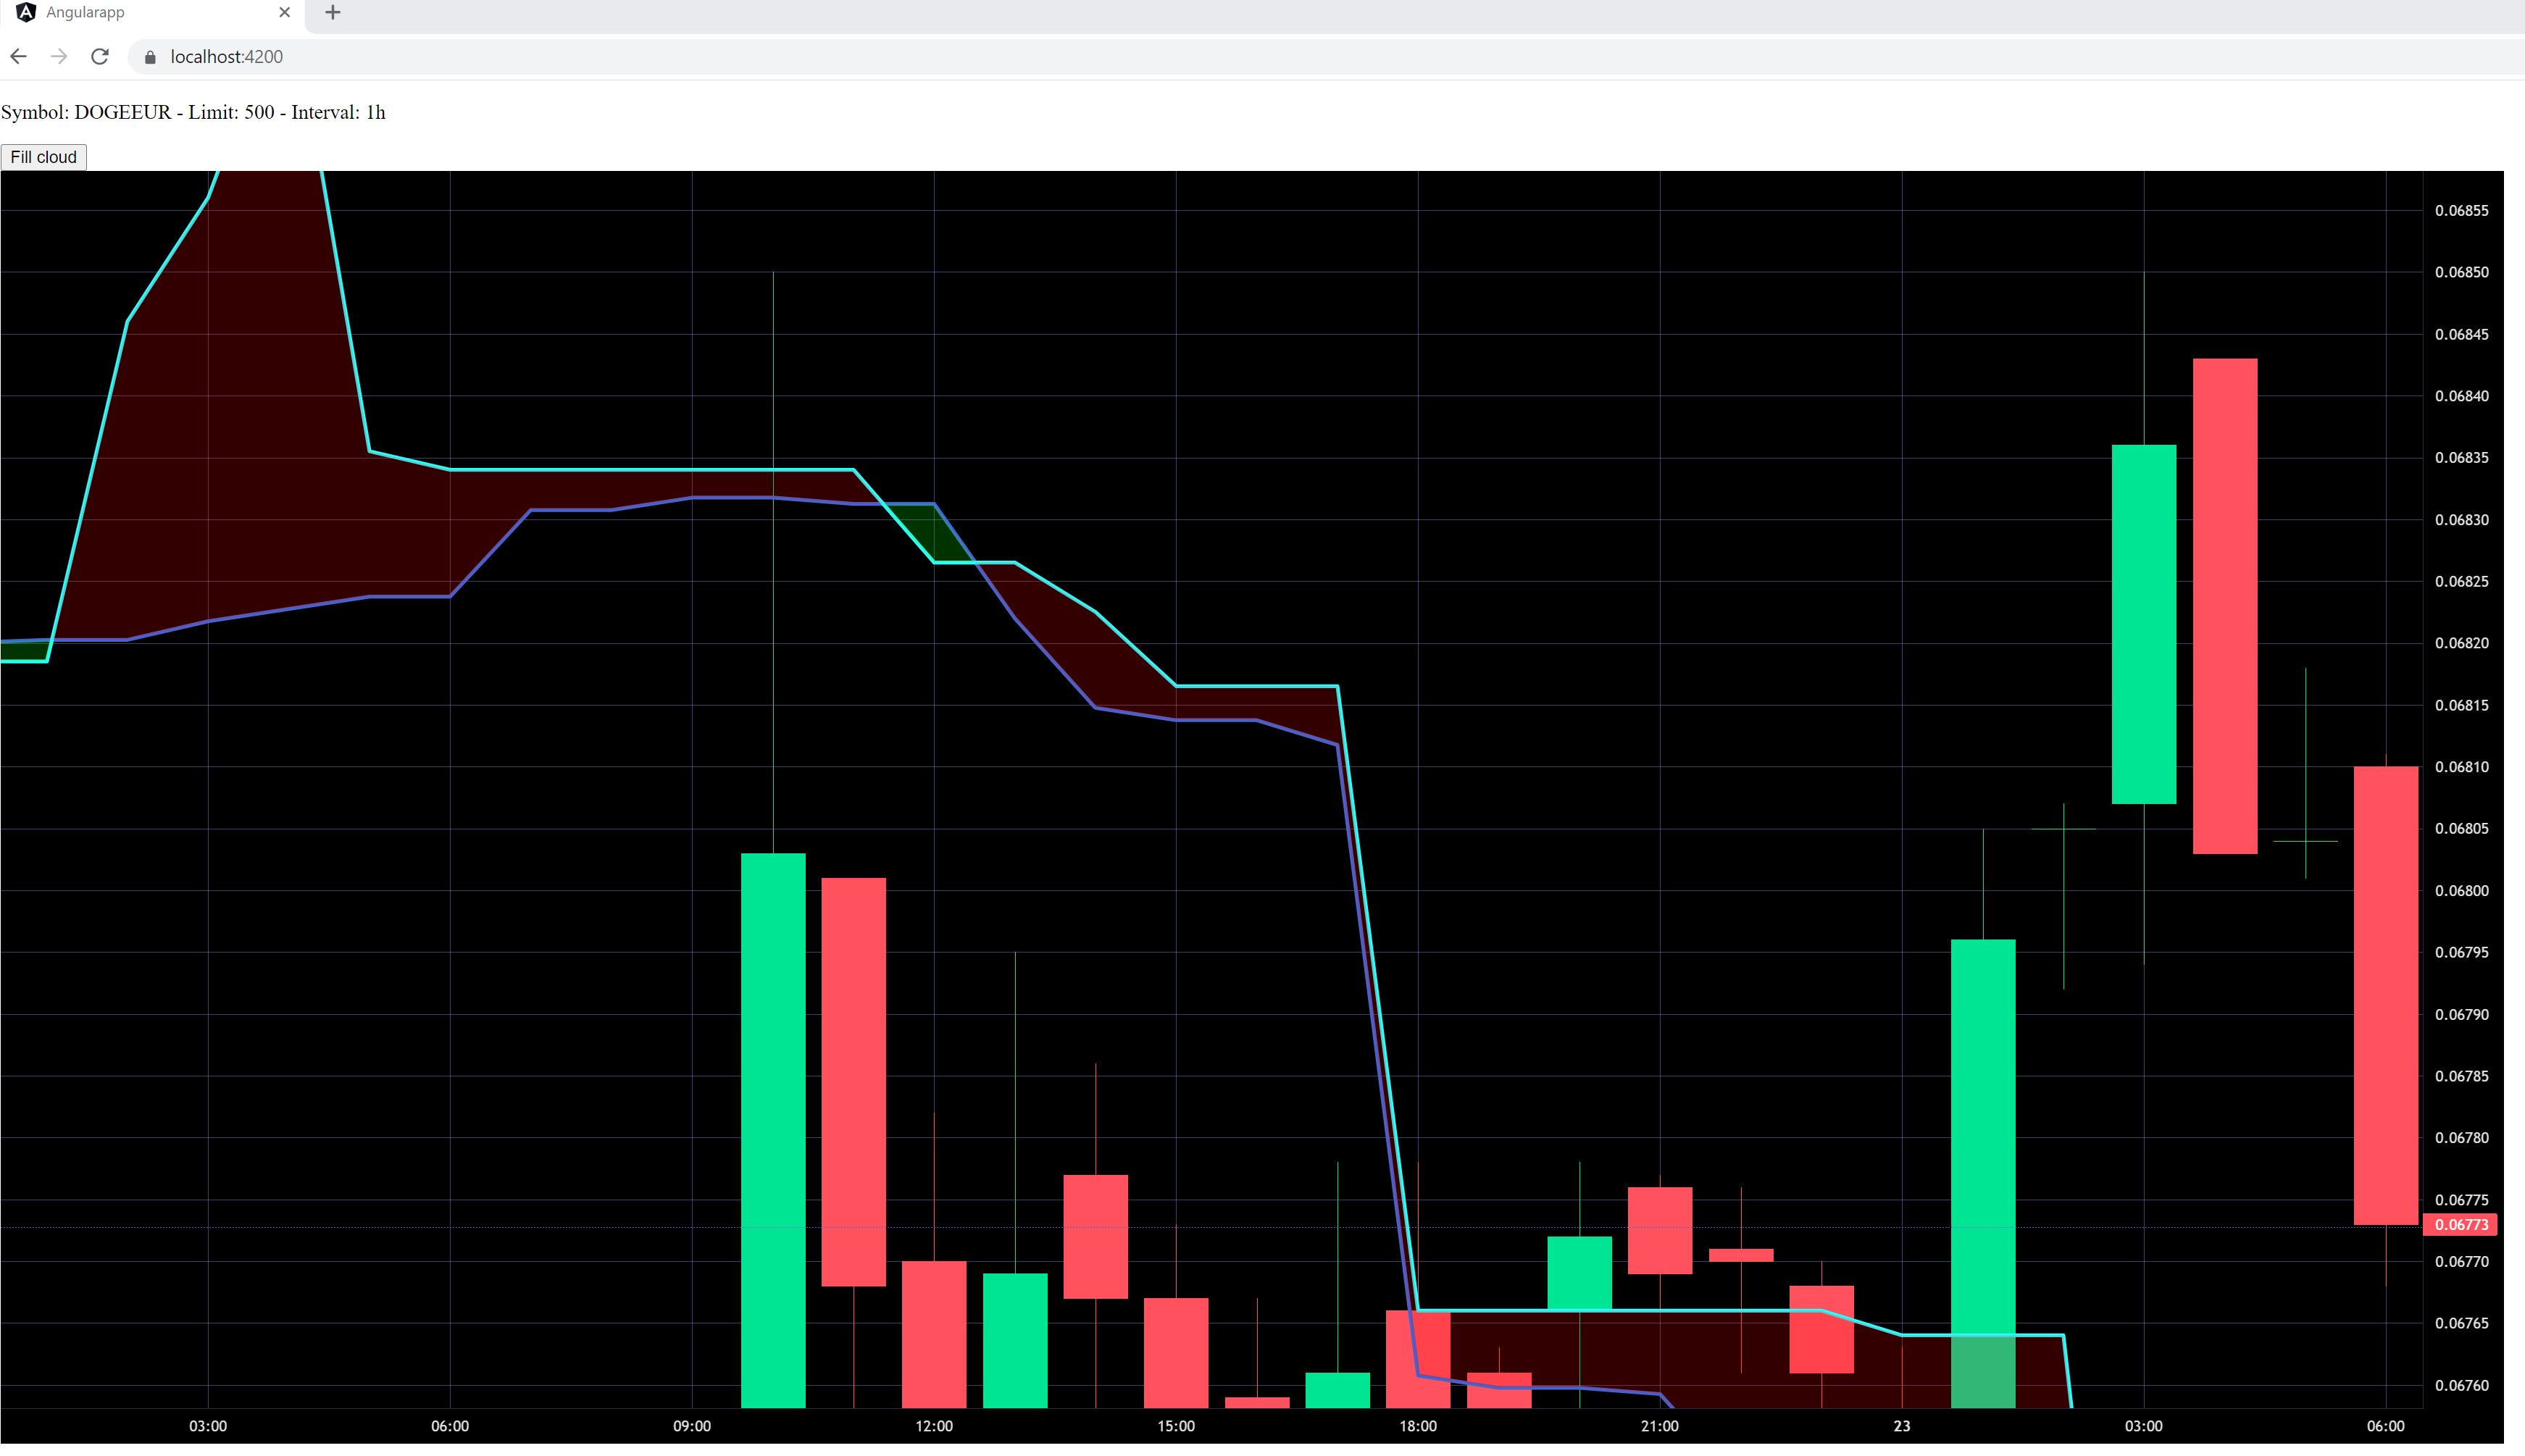
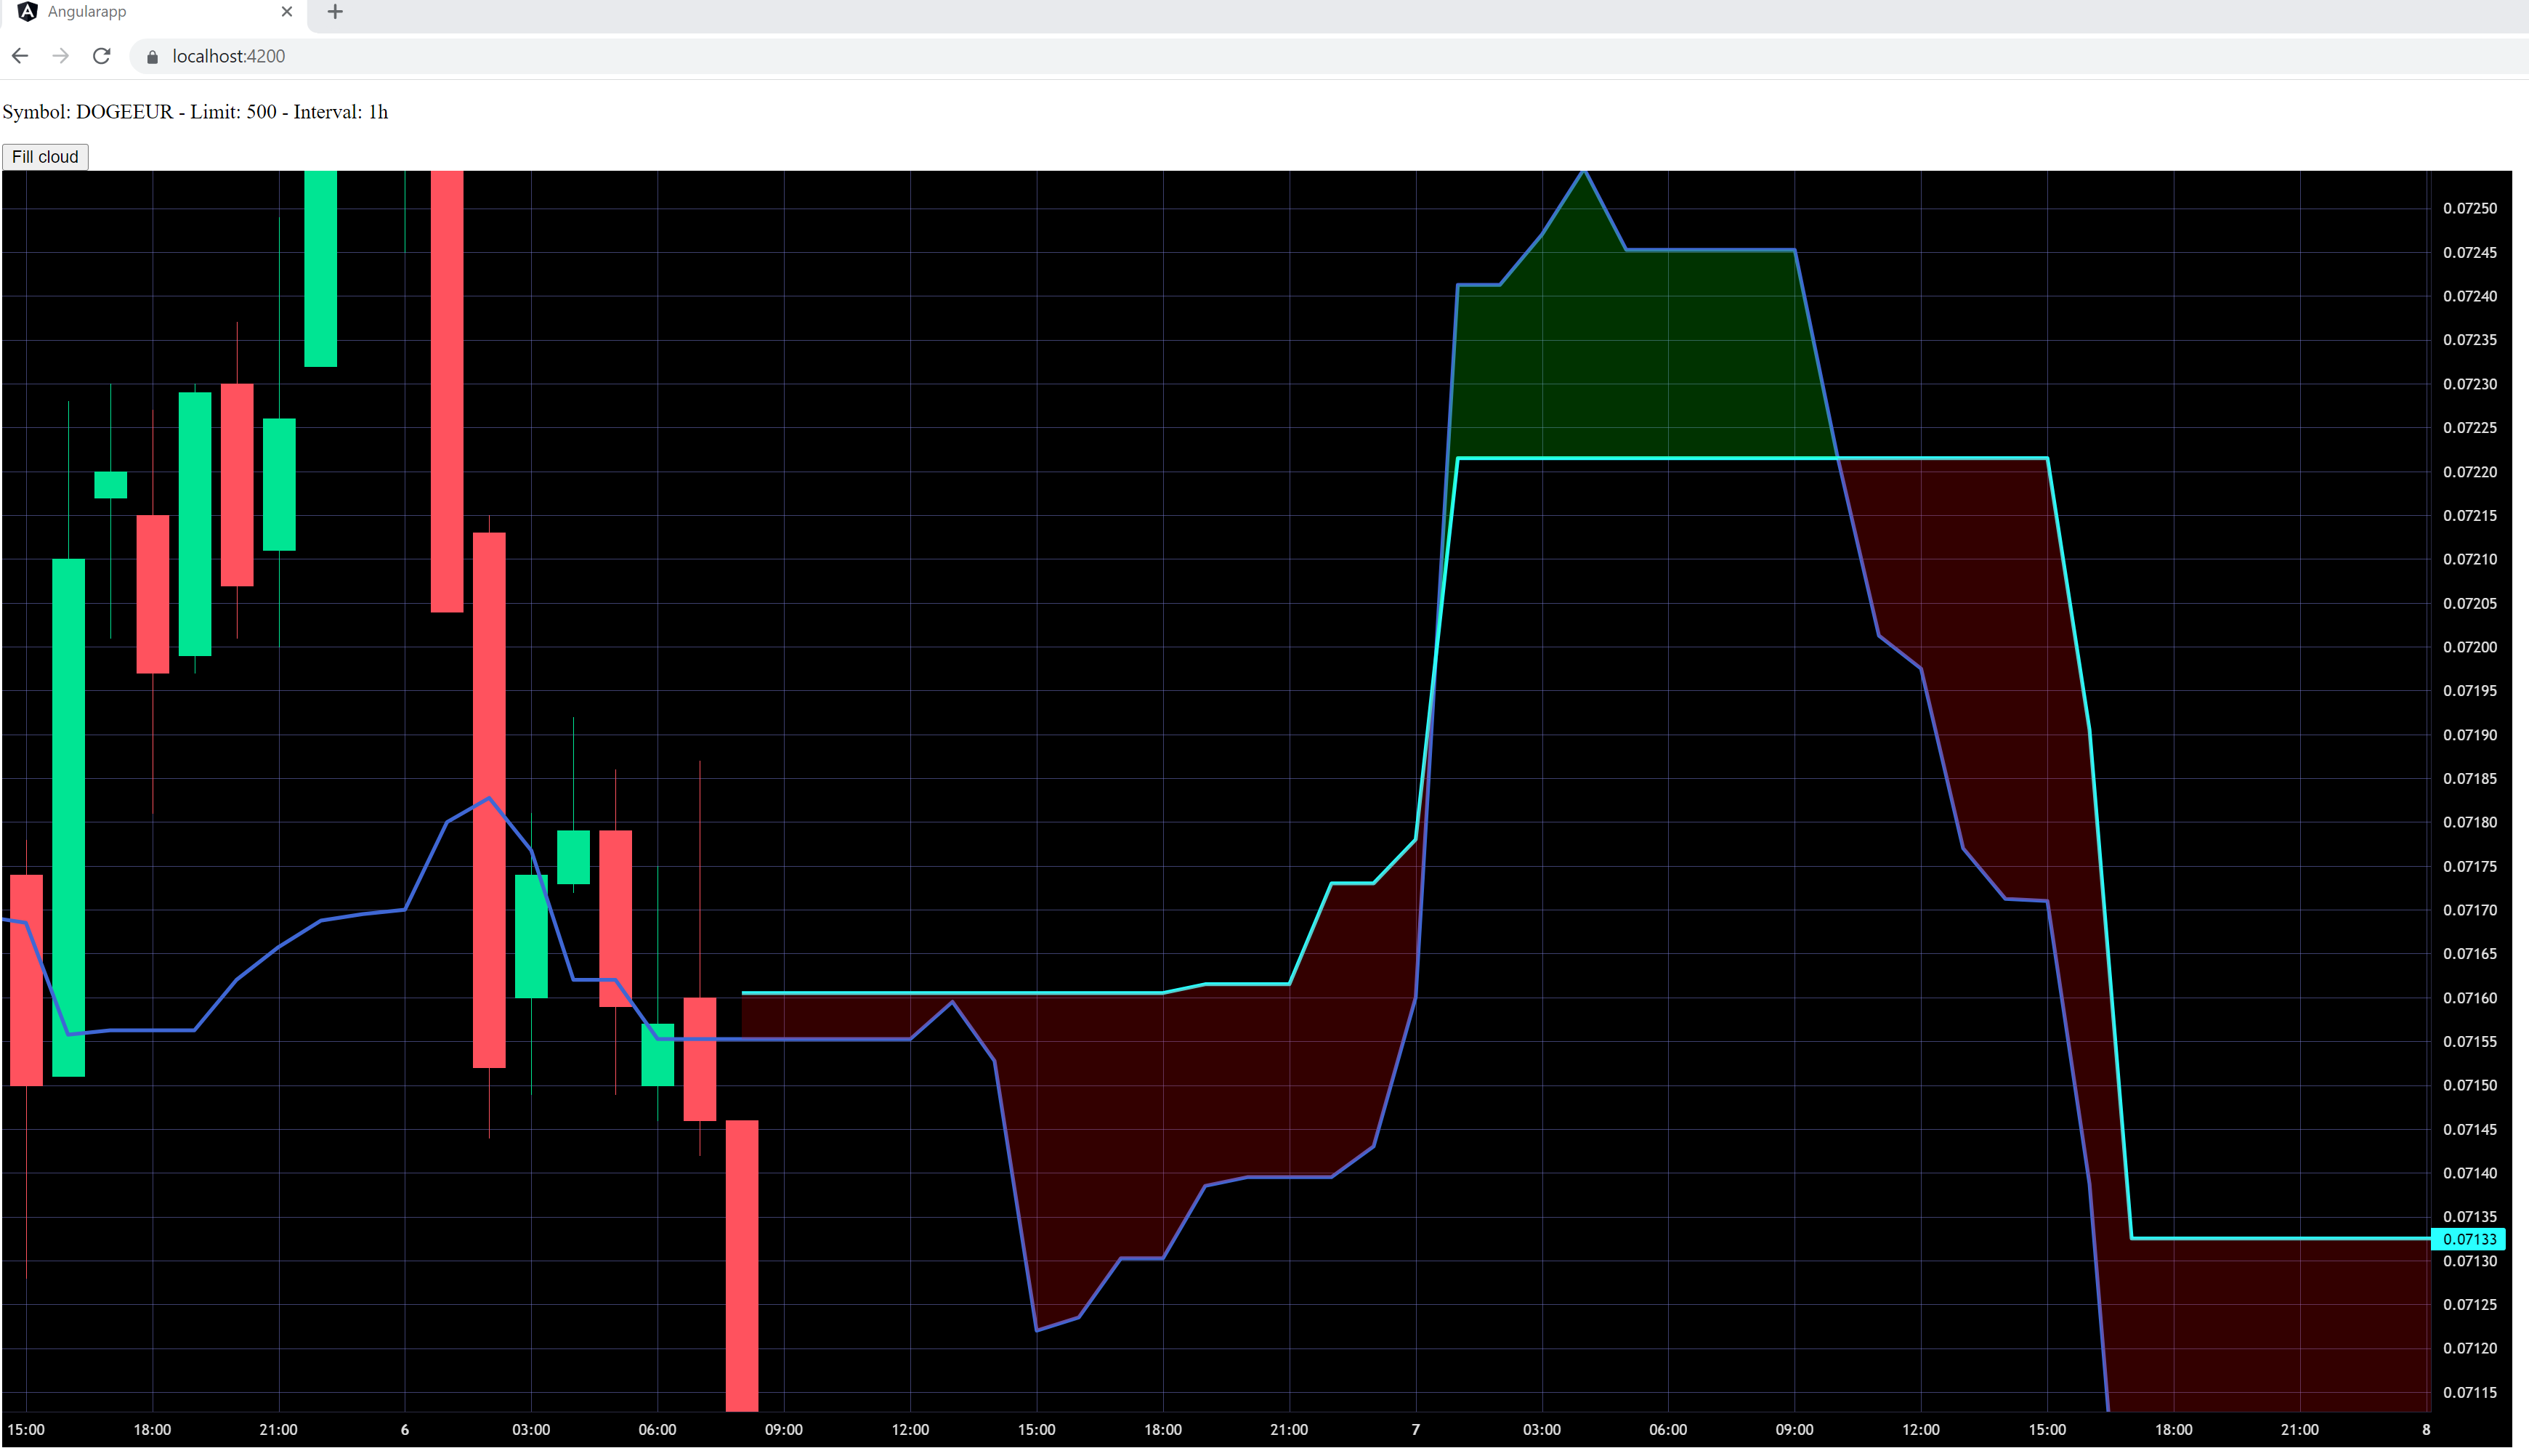
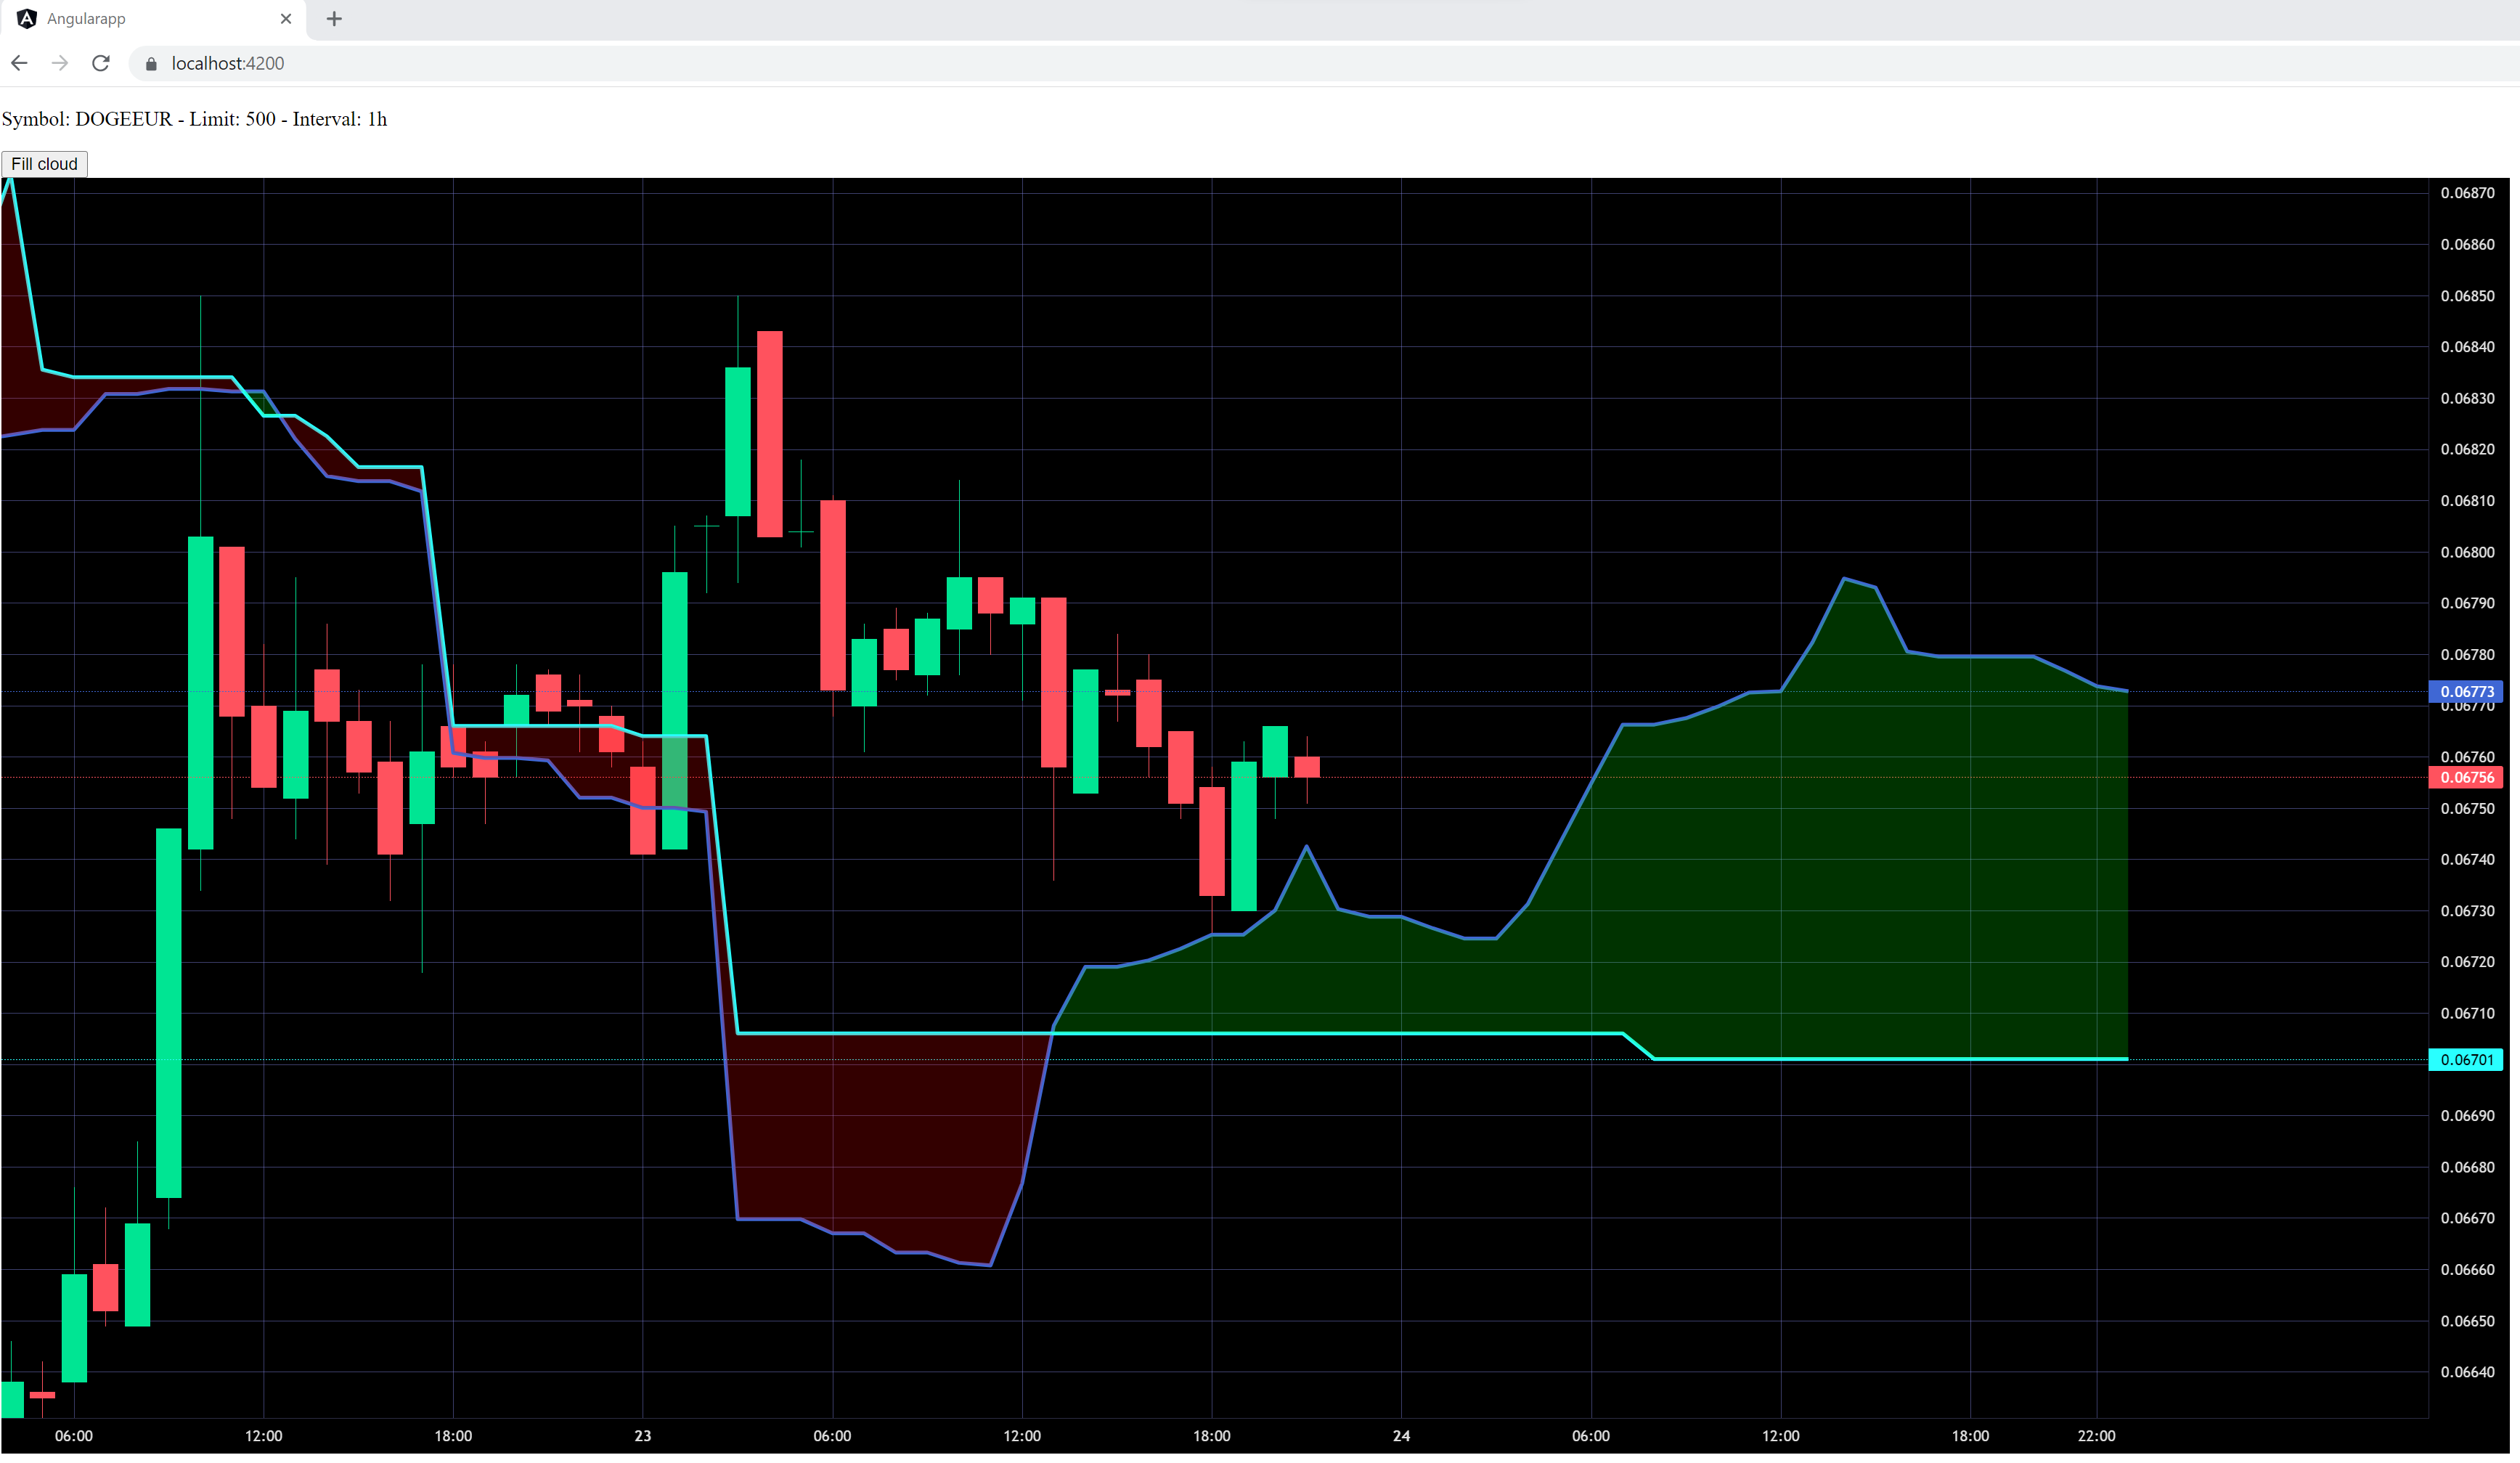
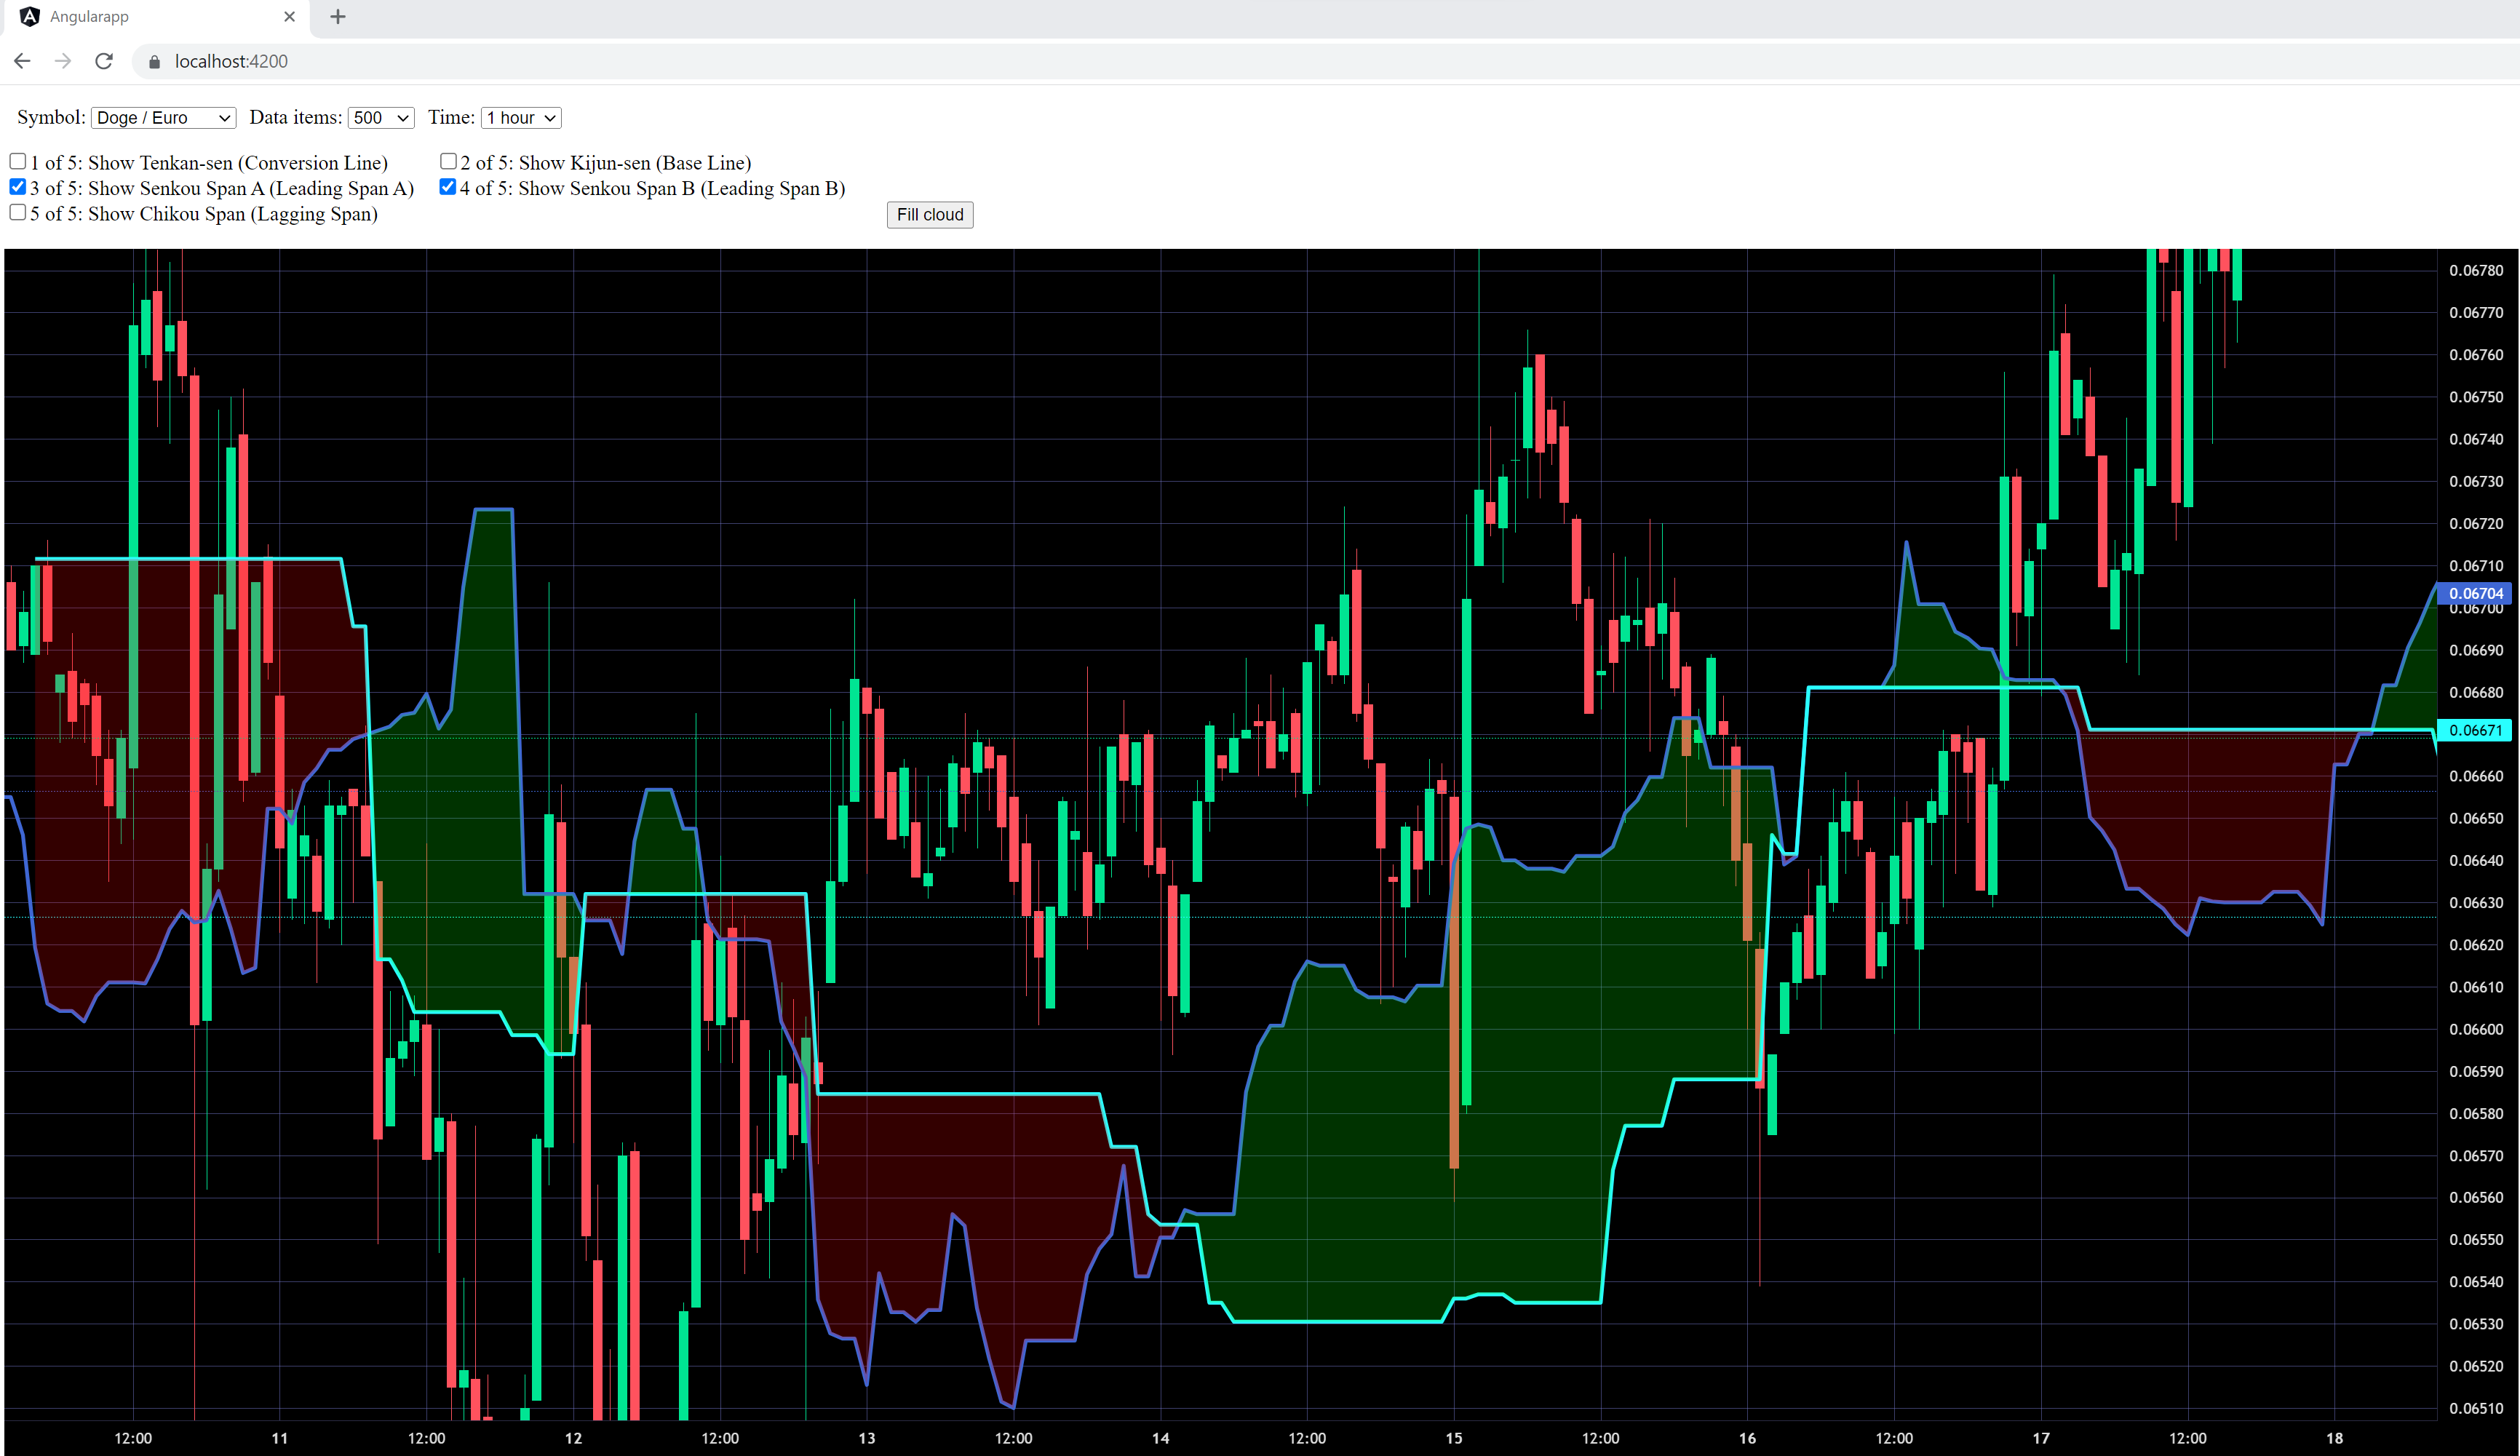
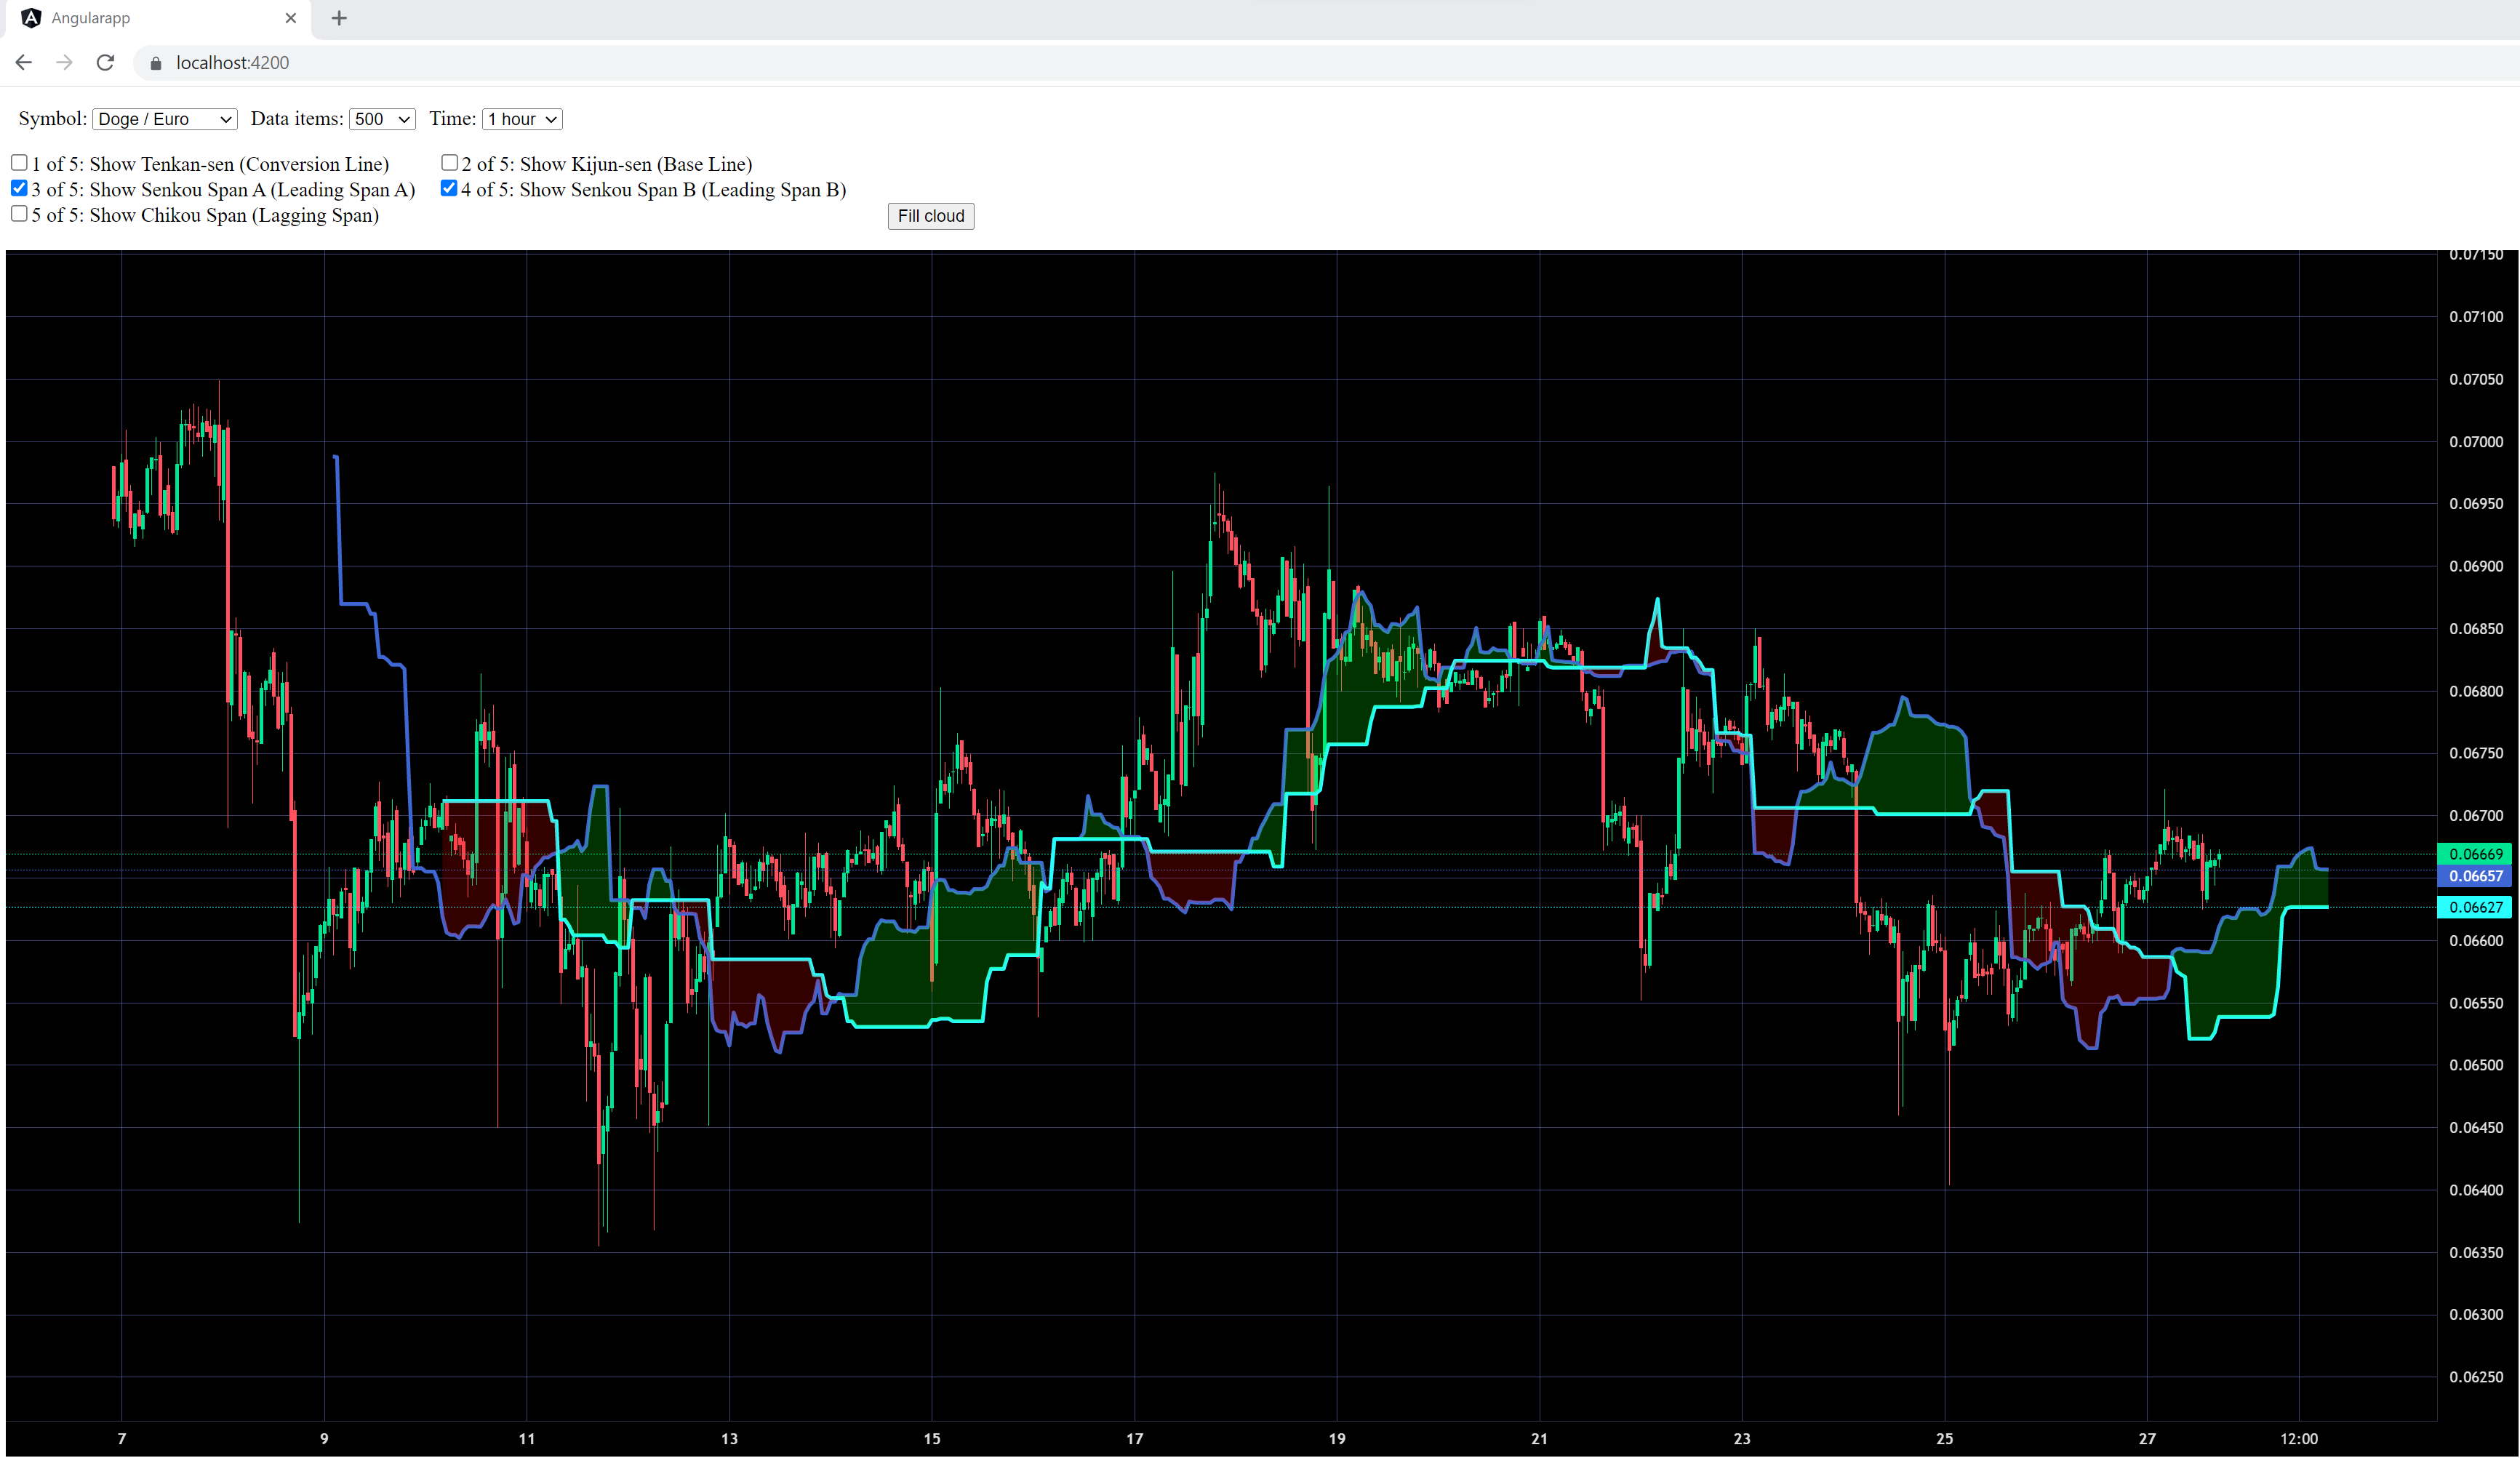
So now answer ... i´ve developed it ... and found some issues in Binance: my solution chart start: chart end: (BTW: my ichimoku implementation contains the correct number of data points in the future - means 26 and not 25 or something else - and of course it can be configured completely dynamically) |
Beta Was this translation helpful? Give feedback.
0 replies
-
|
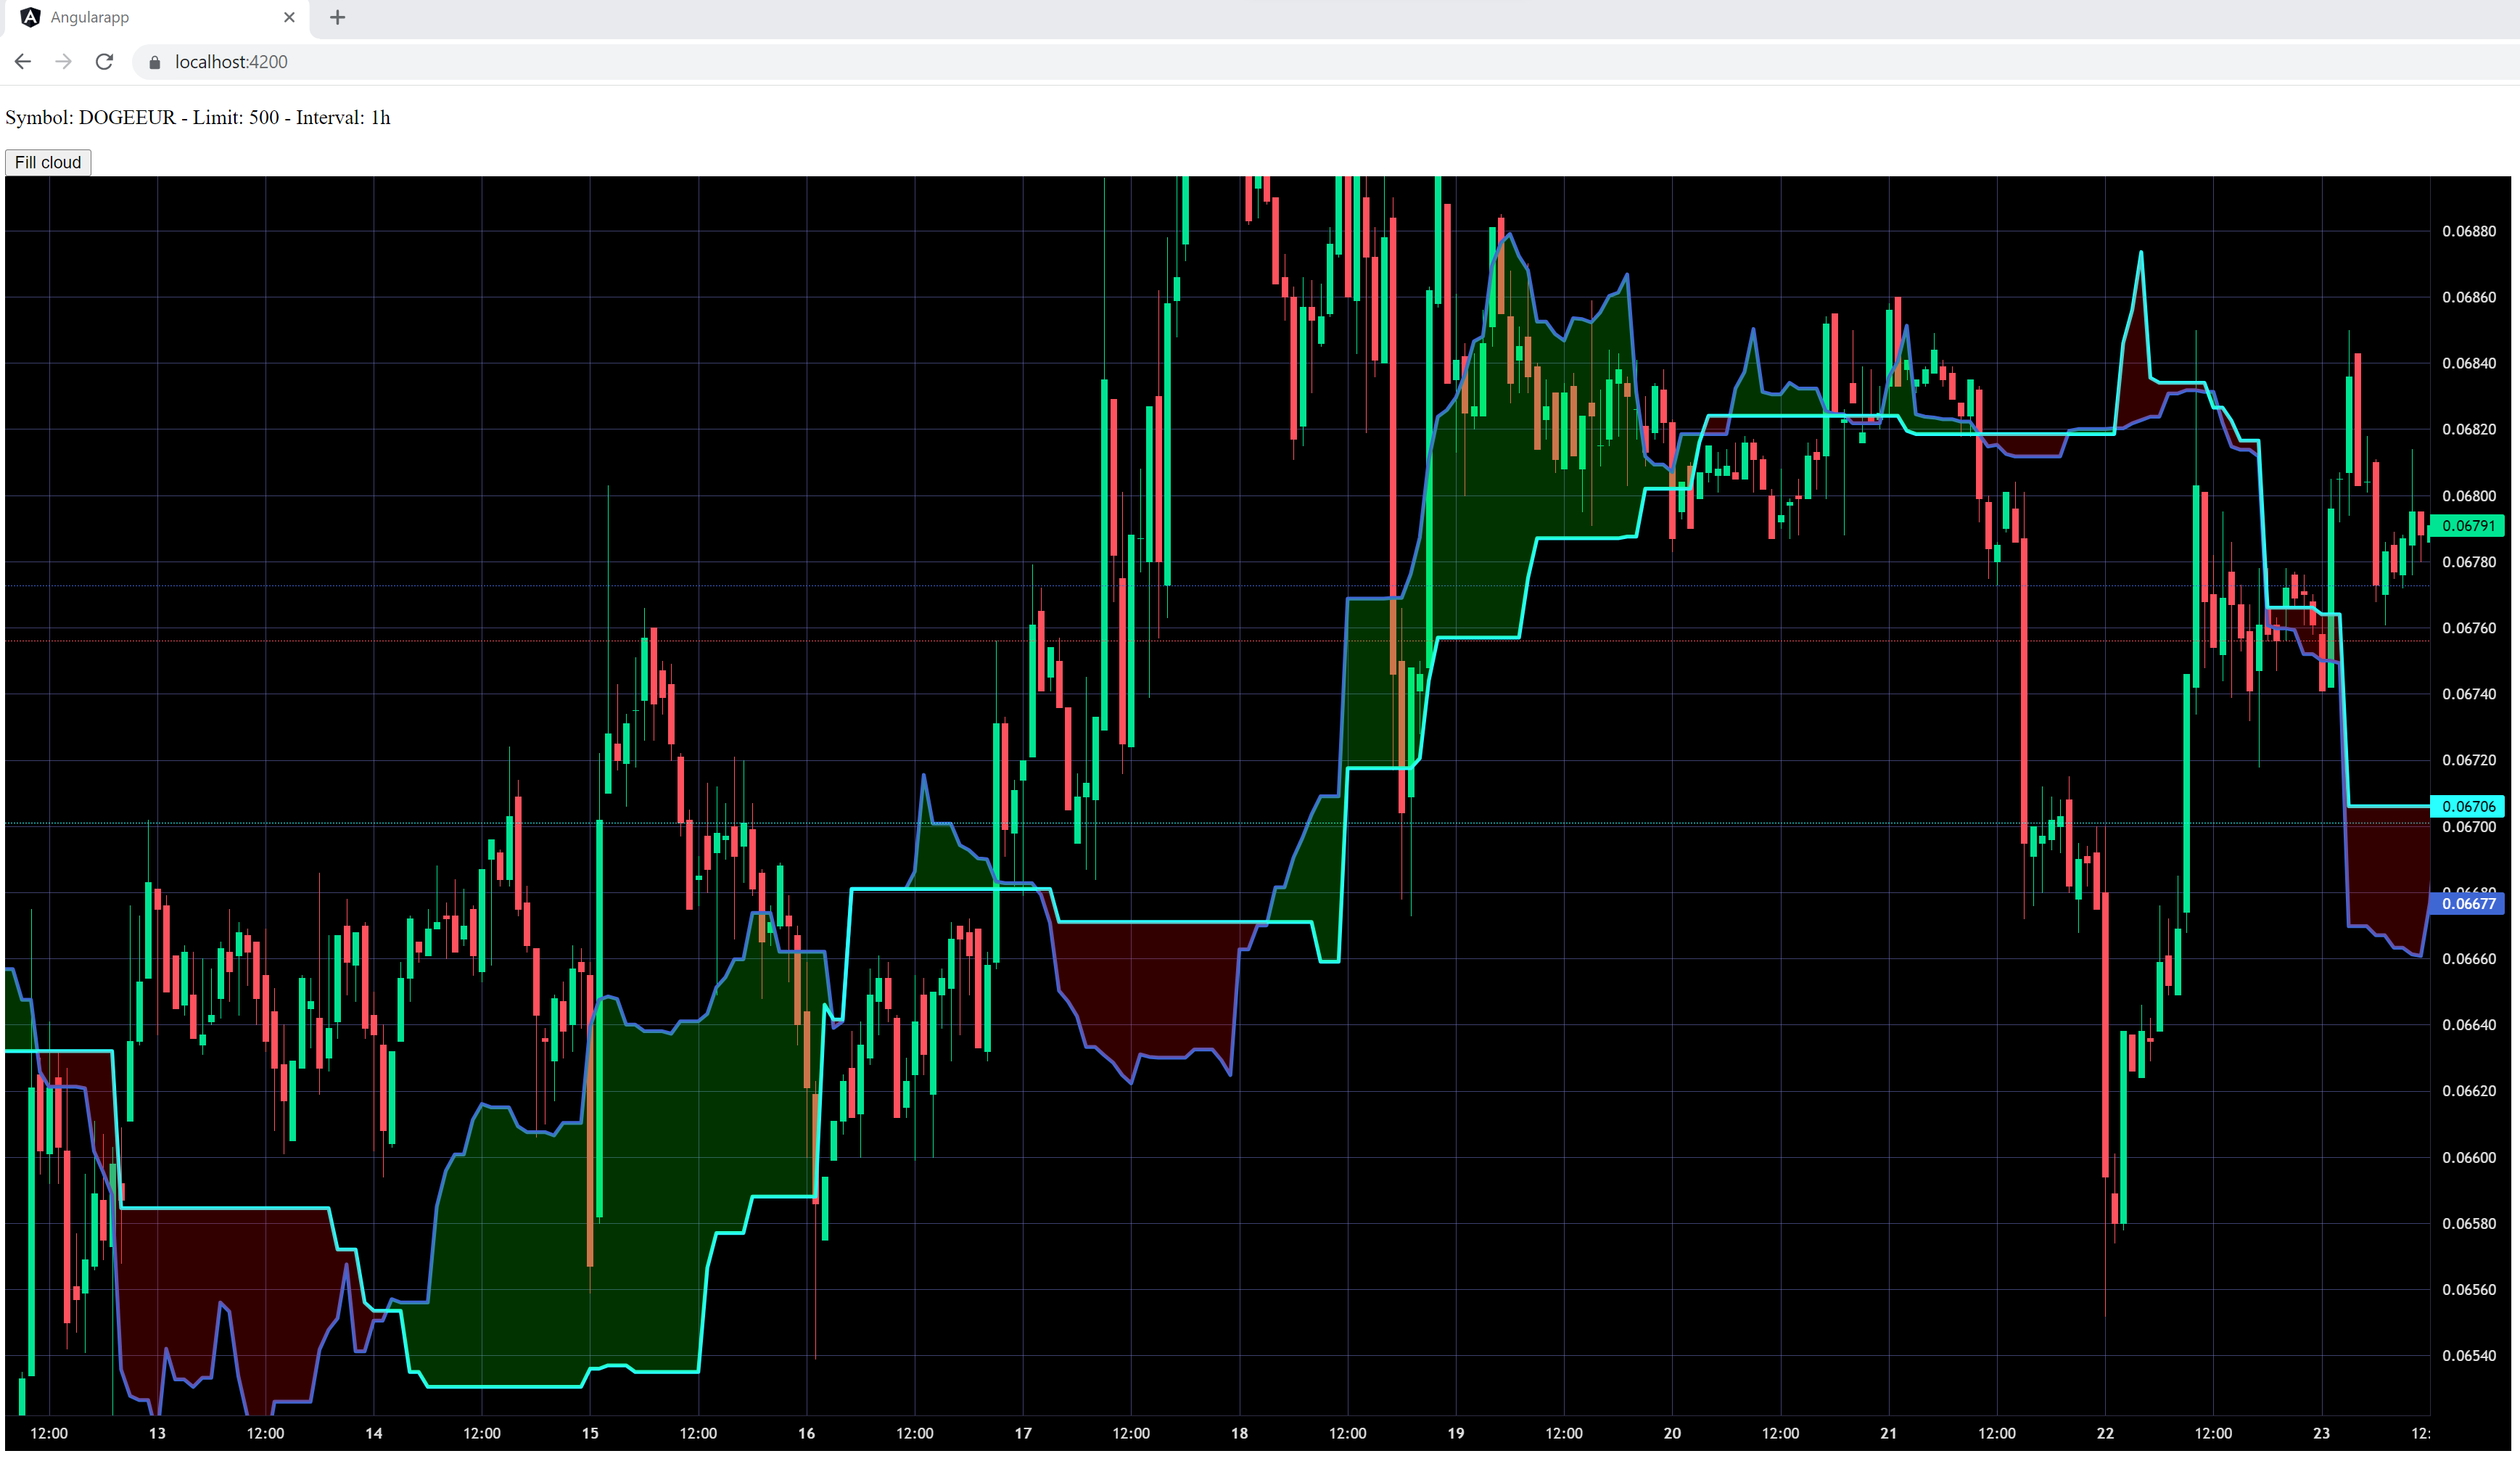
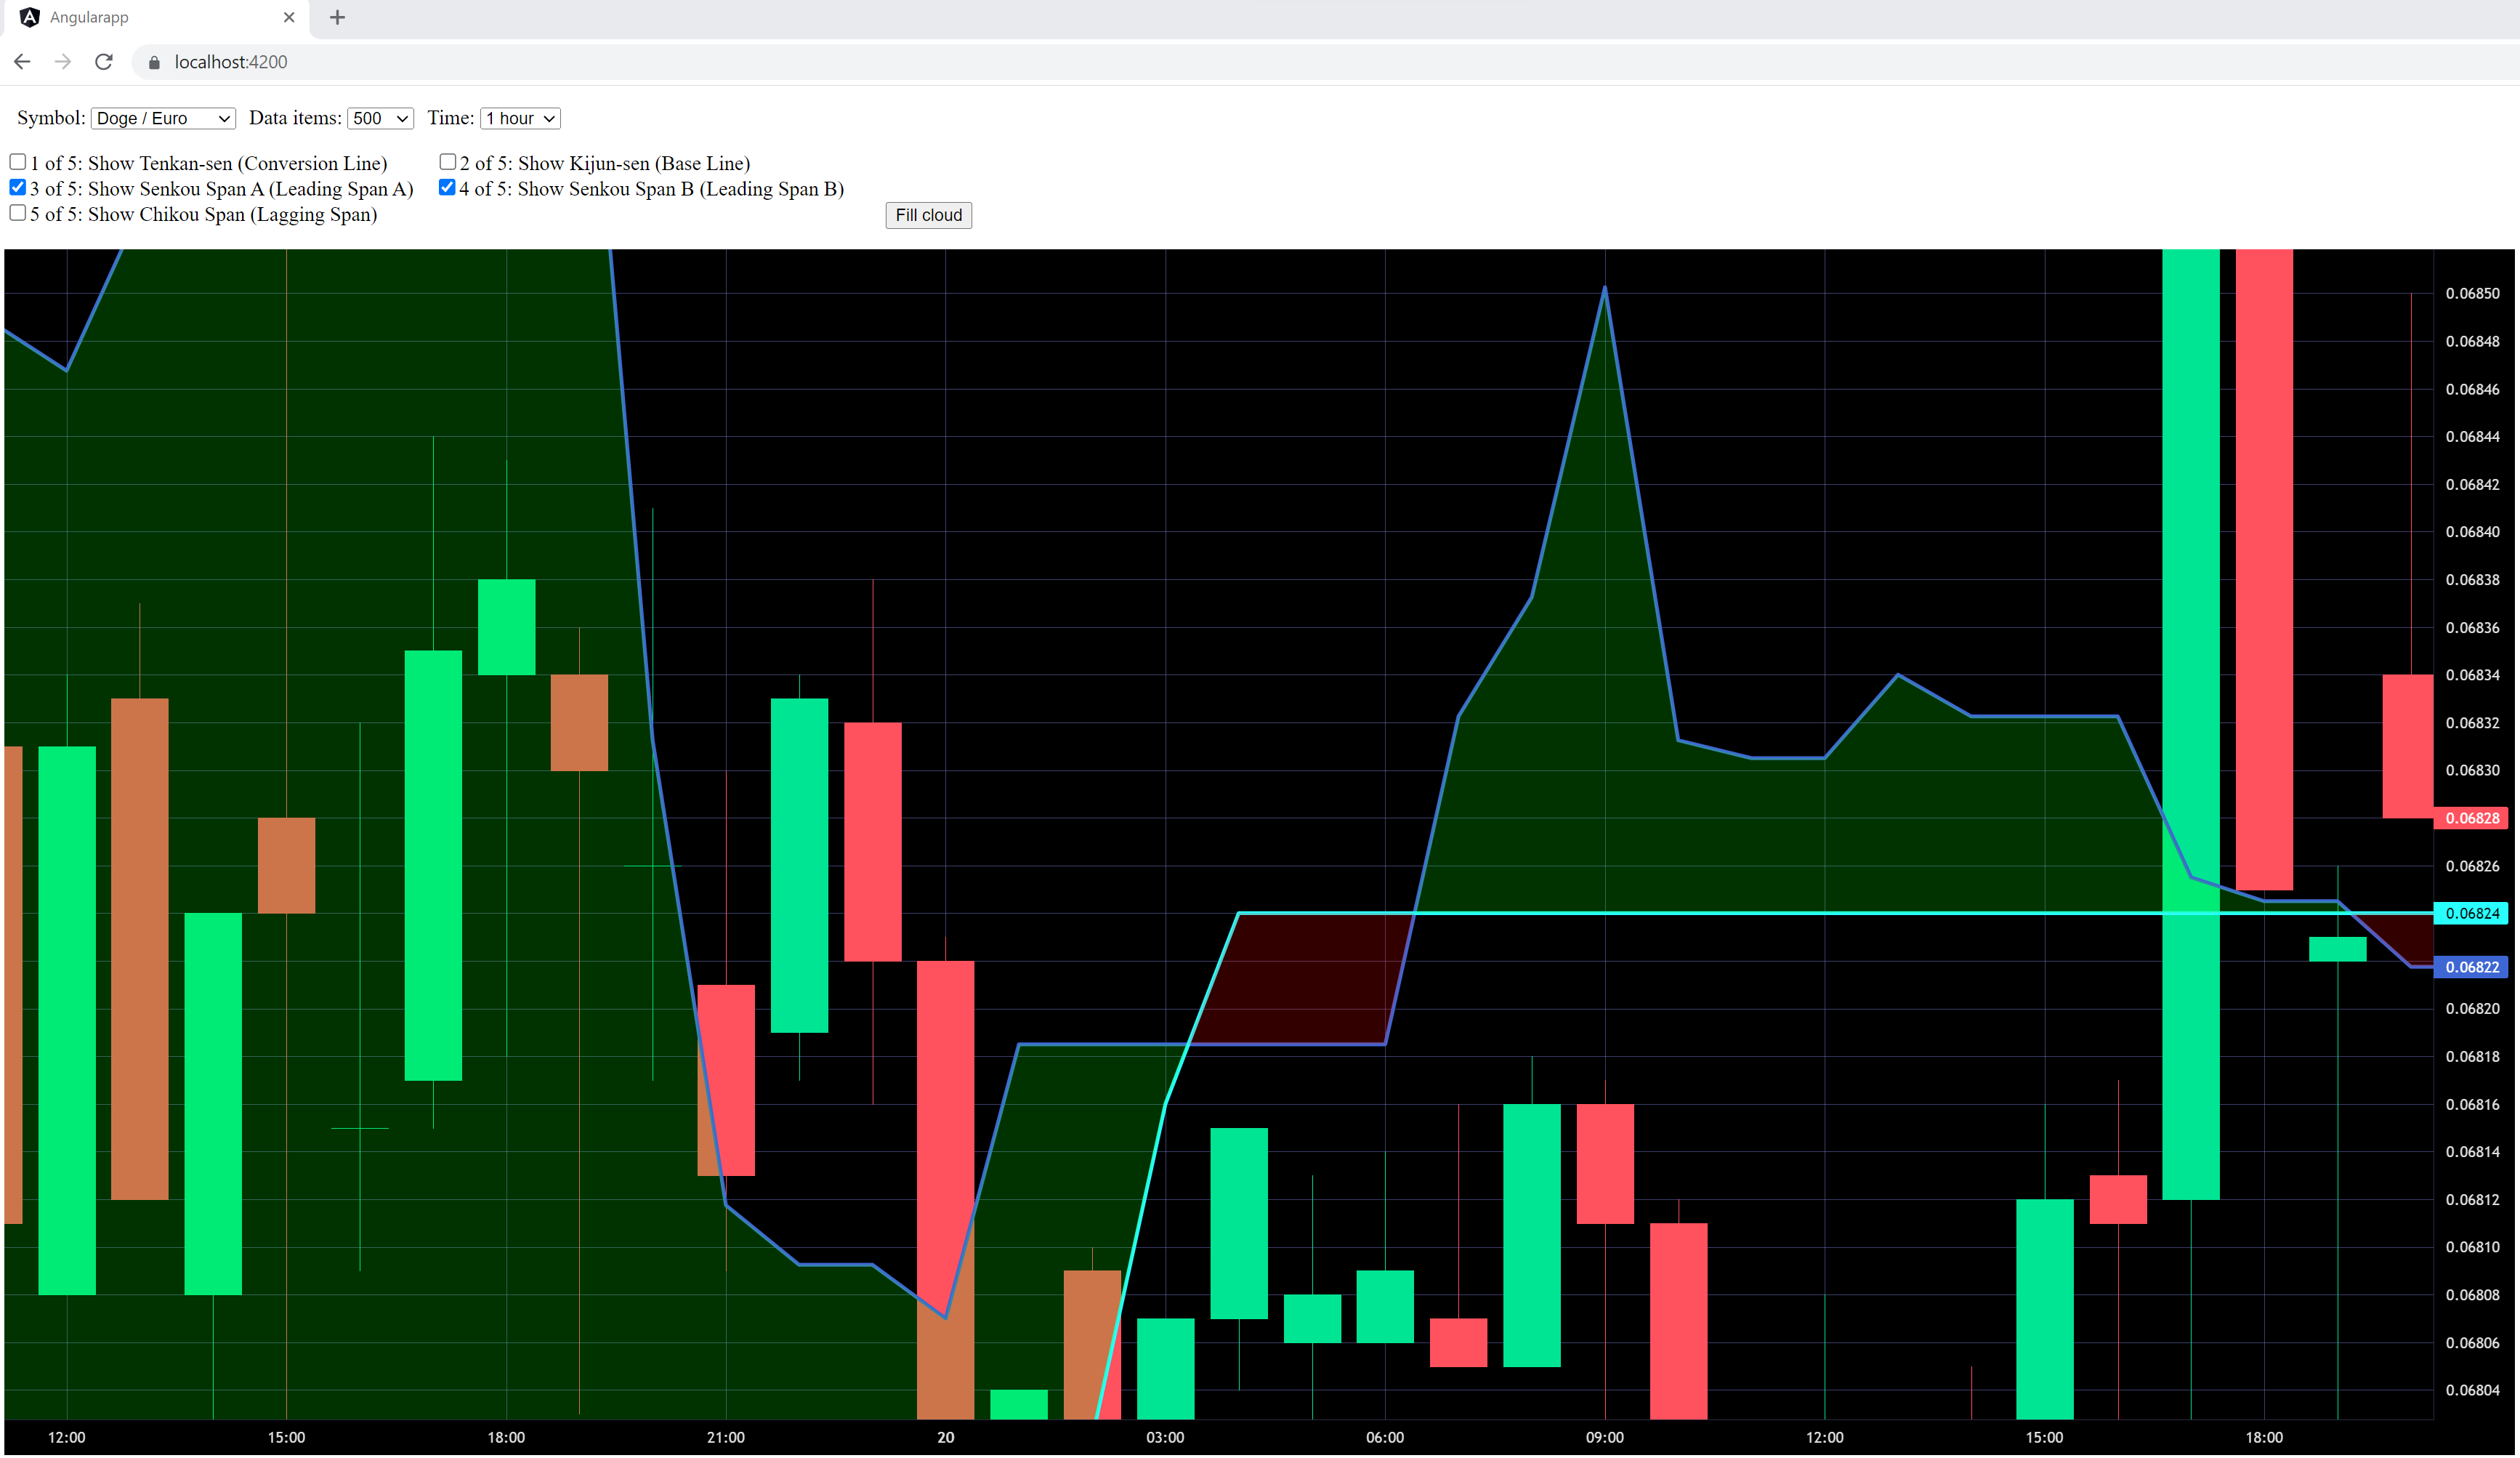
The current state: |
Beta Was this translation helpful? Give feedback.
1 reply
Sign up for free
to join this conversation on GitHub.
Already have an account?
Sign in to comment
-
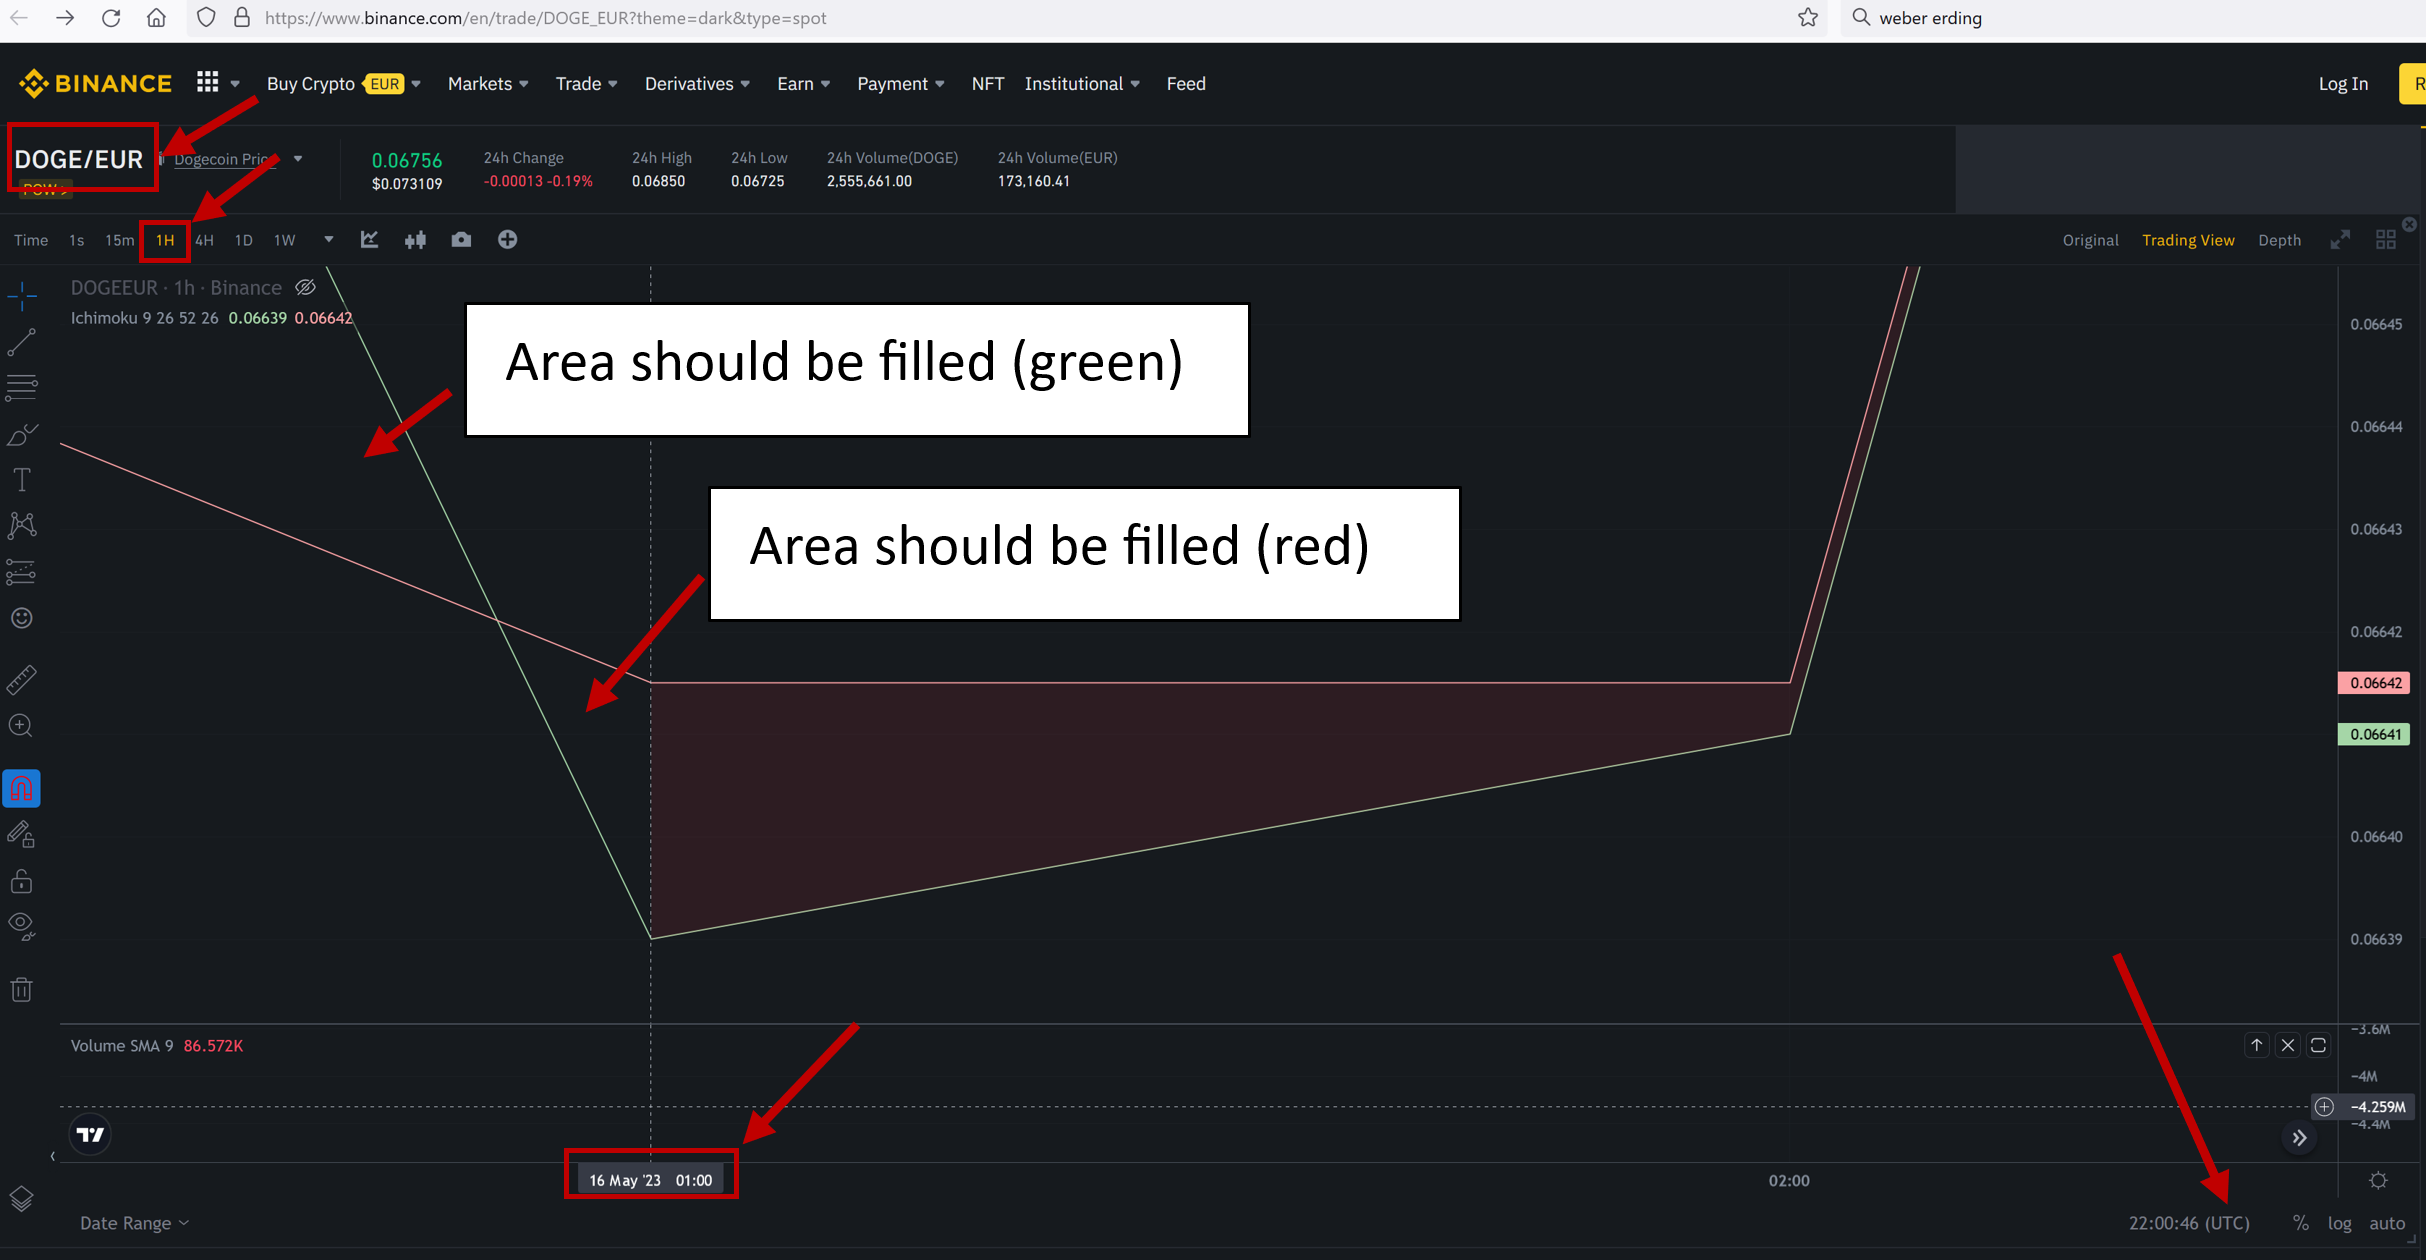
Imagine two line series A and B.
How to fill the space between these two lines?
Please notice that in my case the two line series are part of the calculated Ichimoku data.
Means one array item contains all needed data, like for example for "array item # 47":
result.indicatorResult[47].time = 1682920800result.indicatorResult[47].senkouSpanA = 0.07447result.indicatorResult[47].senkouSpanB = 0.07386result.indicatorResult[47]. ...I believe the important code part should look like this NOT working code:
const dataCloudGreen = result.indicatorResult.filter(item =>item.senkouSpanA != null&& item.senkouSpanB != null&& item.senkouSpanA > item.senkouSpanB).map(item => {return {time: item.time,value: item.senkouSpanA,low: item.senkouSpanB,};});It does not work because there is no "low", nor "value2" property.
Also this does NOT work:
return {time: item.time,value: {high: item.senkouSpanA,low: item.senkouSpanB,}};Any ideas?
Beta Was this translation helpful? Give feedback.
All reactions