Replies: 4 comments 3 replies
-
|
Hmmm, any kind of graphic or screenshot or similar you can paste here for reference? Something to illustrate what it'd ideally show? |
Beta Was this translation helpful? Give feedback.
-
|
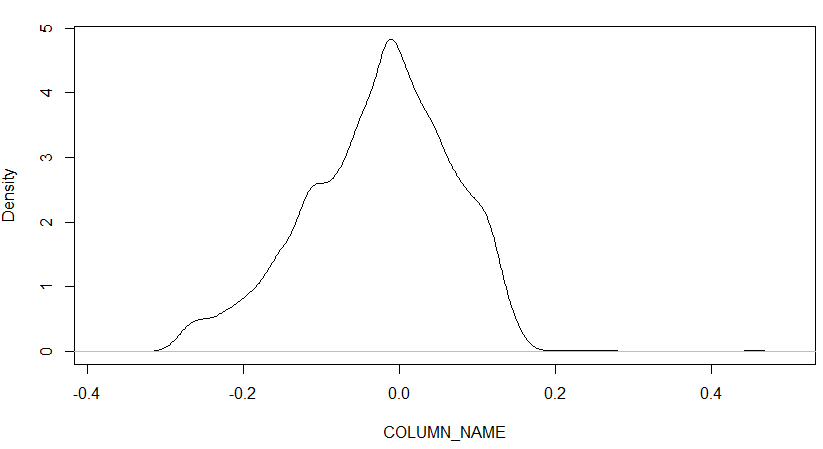
In my work I have a lot of high throughput omics data that gets stored in sqlite. I would be looking for something like this to quickly check the distribution of values in a column. Quick and dirty R example from a column that has a large number of measurement values around somewhat centered around 0. Histogram |

Beta Was this translation helpful? Give feedback.
-
|
Could you not create a view based on the count?
So looking at a table of hotel bookings, most people stay 1 night .. tailing off as the nights increase .. apart from 14 nights (which is expected) You should be able to point the plot at this view? |

Beta Was this translation helpful? Give feedback.
-
|
Generally a good idea, just not very practical for floats/doubles (e.g. see example above, approx 8k unique values, hence the binning/density calculation). In the end, I can do extensive plotting in R; I just thought it would be awesome to have a quick look where you don't have to define own bins etc. |
Beta Was this translation helpful? Give feedback.
-
|
Ahhh, yep. Fairly standard examples of it. Shouldn't be too hard to implement, it just needs one of our developers to have a burst of enthusiasm / interest for it. 😄 |
Beta Was this translation helpful? Give feedback.
-
|
This would be very useful indeed! |
Beta Was this translation helpful? Give feedback.
-
|
I just wanted to +1 this request for enhancement. Having a density plot readily available would be invaluable for eyeballing data. |
Beta Was this translation helpful? Give feedback.
-
Hi all,
awesome program.
I understand that the program shall be as sleek as possible but a feature that I am missing a lot is a density/histogram plot to get a feel for the data in a single column. Basically a way to very quickly check the distribution of values in a numeric column via the plot function. Either via density plot or a histogram plot or so fourth.
Any thoughts?
Cheers
Beta Was this translation helpful? Give feedback.
All reactions