Improve DX on Sentry.trace #8075
Comments
|
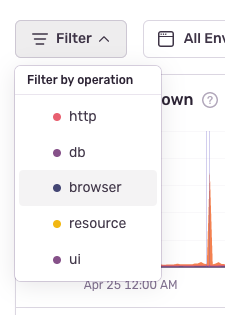
Name is required because it maps to Op is used for breakdowns and high level analysis, for example for this view:
In OpenTelemetry high level aggregates, like identifying if something is a database or http span is powered by semantic understanding of arbitrary span attributes: https://opentelemetry.io/docs/reference/specification/trace/semantic_conventions/. If a span has the The trace function was recently added, and not documented as we were working toward getting it to a stable state. It'll be public soon. |
|
Can't name default to op? Like isnt op actually required? Name is just our transaction specific thing, that only matters when its a transaction? Basically how do we avoid this issue where a customer has to provide 2x the same annotation that mean the same thing? I'm trying to get this to be as simplea s otel's api which only requires the op name as the first param (and optional context, which is not a simple DX, as the second). Alternatively if name == description, same thing, but afaik there are only two columns outside of tags/data |
|
Actually name is required - it's the unique identifier that groups spans together, op is just a higher level bucket. For example a For all intents and purposes transaction name === span description === otel span name. OTEL doesn't have anything equivalent to how we define op, this is a Sentry specific thing. I agree to 2x annotation is annoying, I want us to fix this and properly consolidate name/description. |
|
Copying over the initial proposal from notion: https://www.notion.so/sentry/Performance-simplified-59c8872f1173439b97386f14dd0ea0c6 Use CasesUser story: As a developer I can send performance data about my function calls to Sentry so I get duration information about those calls while maintaining correct parent child relationship between timing information. Timing a function call:SDKs should expose a decorator/wrapper function that automatically starts a span when the function starts, and stops the span when the function finishes.
@Sentry.trace({ name: 'expensiveCalc' })
function expensiveCalc() {

}

// span that is created is provided to callback in case additional
// attributes have to be added.
// ideally callback can be async/sync
Sentry.trace({}, (_span) => expensiveCalc());

// If the SDK needs async/sync typed different we can expose this
// declare function Sentry.traceAsync(spanCtx, asyncCallback);
Under the hood, the SDK takes care of creating a transaction/span accordingly and managing if it should be on the scope. Overriding when span is finishedIn case the wrapped callback finish shouldn’t map to span finish, use a manual trace function to determine when exactly to finish the span. function handler(req, res) {
// todo name kind of sucks
Sentry.traceManual({ name: 'expensiveCalc' }, (span) => {
expensiveCalc();
// span needs to finish on response end callback,
// not when handler is finished.
res.on('end', () => span.finish());
})
}Exact control over starting/stopping spansIn the case where you want even more control, manually call start span and finish span. Note that you’ll have to add this to the scope yourself if you do this (otherwise the callback based wrappers should be good enough) // does not get put on scope, user's have to do this manually
const span = Sentry.startSpan({ name: 'expensiveCalc' });
expensiveCalc();
span.finish();
// Optionally SDKS can expose a Sentry.startActiveSpan API to have it
// be automatically put on the scope. This is dangerous because then the span
// is potenially never removed from the scope if users don't call finish on it.
// In Go and other langs with explicit ctx this probably needs to be
// Sentry.StartSpanFromContext(ctx, spanCtx)Monkeypatching module functionsInspired by Sentry.init({
functionsToTrace: {
'moduleA.method1': {},
// override span context
'moduleA.method2': { name: 'bestModule' },
}
// alternate API is to use tuples
// functionsToTrace: [
// ['moduleA.method1'],
// ['moduleA.method2', { name: 'bestModule' }]
// ]
});
// We can also expose a wrapping method for languages which
// can't do the string based dynamic monkeypatching
const { fancyMethod as _fancyMethod } = require('third-party-library');
export const fancyMethod = Sentry.traceWrap(fancyMethod)
// We can also expose a method to automatically instrument all exported
// methods from a module
// 2nd argument is same as functionsToTrace
Sentry.traceModuleMethods('module-name', { 'method1': { name: 'renamed' } }); |
q: This would only work for CJS, right? Given that everyone is moving to esm (slooowly), should we even create this API? |
Other SDKs can take advantage of it, and JS would probably provide an esm specific solution with loaders. |
Collection of concerns carrying over from Slack:
It appears
opis required (at least withdebug=truethe logs look funky), butnameis actually required per the type defs. AFAICT they're the same thing, so why are they different?Additionally we do not document the
tracefunction, and its key to success with instrumentation. I would expect this to at least be a subset of the OTel equiv docs, and I would expect them to exist on the core instrumentation page.Both of these issues might carry over to every SDK, I'm not sure.
The text was updated successfully, but these errors were encountered: