Are you a first-timer in contributing to open source? These guidelines from GitHub might help!
The project Algorithm Visualizer has a visualization library in each supported language (JavaScript, C++, and Java) to visualize codes.
There are five tracers in the library to visualize different types of data:
There are also randomizers to help you create random data.
Check out the API reference for more information.
At the bottom left corner of algorithm-visualizer.org, there is Scratch Paper where you can visualize your own code.
We highly encourage you to test your visualization on Scratch Paper several times before creating a pull request.
- Category A/
- Algorithm A/
- code.js
- code.cpp
- code.java
- README.md
- Algorithm B/
- Algorithm C/
- ...
- Algorithm A/
- Category B/
- Category C/
- ...
-
Fork this repository.
'Fork' button is at the top right corner of this page.
-
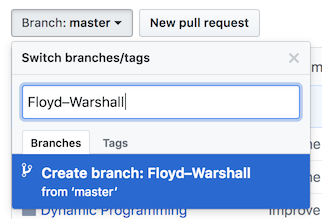
Create a branch named the algorithm you'd like to add/improve.
'Branch' button is below the header of your forked repository.
-
Make changes.
Understand the directory structure, and create or edit files accordingly.
If you want to create a directory, check out this Stack Overflow answer.
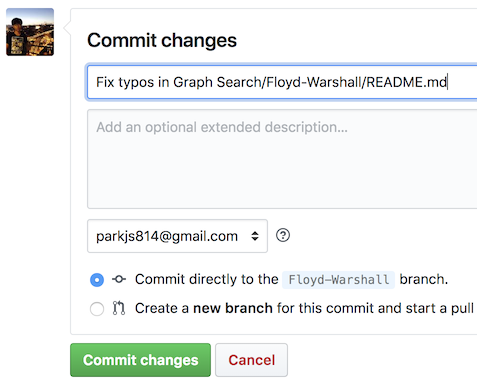
Input a commit message addressing your changes, and make sure you are committing to the branch you created.
-
Create a pull request.
'Compare & pull request' button is below the header of the main page of your forked repository.
Make sure you are merging to
algorithm-visualizer/algorithms'smasterbranch from your forked repository's branch you created. -
Thanks for your contribution! Once we review and merge your pull request, your changes will be reflected on algorithm-visualizer.org.


